前回は,NOAAの数値予報モデル GFS のデータをダウンロードして,上空の寒気をプロットしてみましたが,ダウンロードした GFS のファイルには,他にも多くのデータが含まれています。
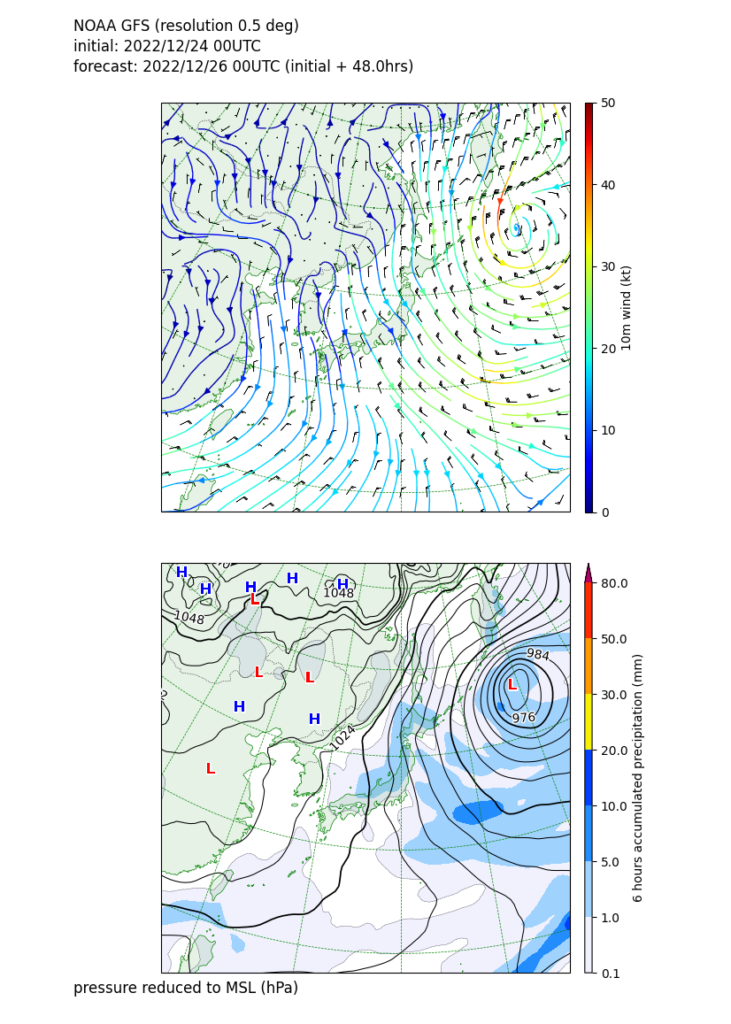
今回は,同じデータファイルに含まれる平均海面高度の気圧と降水量,地表付近の風を取り出して,次のようなプロットをしてみたいと思います。

macOS Monterey 12.6.2, Python 3.9.15, pygrib 2.1.4, MetPy 1.3.1
Pythonでやってみる気象データ解析の技術書を販売中
¥2,500 → ¥1,500 今なら40%OFF!!
気象の勉強をされている方必読!
気象予報士でもある著者がわかりやすく解説
プログラムを公開しているのでお手元で試せます!
GFS データに含まれるデータの確認
GFSデータのダウンロードの仕方については,前回の記事を参照してください。
データの中身をターミナルに出力してみましょう。
次のようなコードを書いて,データが保存されているディレクトリ(ここでは,~/Desktop/LabCode/python/gfs-wnd-mslp-prcp とします)に適当な名前(ここでは,print-gfs-data.pyとします)をつけて保存してください。
ファイル名はダウンロードしたファイルの名前に合わせて変更してください。
import pygrib

# 読み込むデータのファイルパス (適宜変更してください)
fname_gfs = "gfs_4_20221224_0000_048.grb2"

with pygrib.open(fname_gfs) as gribin:
    for g in gribin:
        print(g)
データが保存されているディレクトリに移動して,先程のプログラムを実行します。
$ cd ~/Desktop/LabCode/python/gfs-wnd-mslp-prcp
$ python3 print-gfs-data.py
出力結果は以下のようになりました。
1:Pressure reduced to MSL:Pa (instant):regular_ll:meanSea:level 0:fcst time 48 hrs:from 202212240000
2:Cloud mixing ratio:kg kg**-1 (instant):regular_ll:hybrid:level 1:fcst time 48 hrs:from 202212240000
3:Ice water mixing ratio:kg kg**-1 (instant):regular_ll:hybrid:level 1:fcst time 48 hrs:from 202212240000
4:Rain mixing ratio:kg kg**-1 (instant):regular_ll:hybrid:level 1:fcst time 48 hrs:from 202212240000
5:Snow mixing ratio:kg kg**-1 (instant):regular_ll:hybrid:level 1:fcst time 48 hrs:from 202212240000
...
中間省略
...596:Total Precipitation:kg m**-2 (accum):regular_ll:surface:level 0:fcst time 42-48 hrs (accum):from 202212240000
597:Total Precipitation:kg m**-2 (accum):regular_ll:surface:level 0:fcst time 0-48 hrs (accum):from 202212240000
739:V component of wind:m s**-1 (instant):regular_ll:potentialVorticity:level 2.147485648 K m2 kg-1 s-1:fcst time 48 hrs:from 202212240000
740:Temperature:K (instant):regular_ll:potentialVorticity:level 2.147485648 K m2 kg-1 s-1:fcst time 48 hrs:from 202212240000
741:Geopotential Height:gpm (instant):regular_ll:potentialVorticity:level 2.147485648 K m2 kg-1 s-1:fcst time 48 hrs:from 202212240000
742:Pressure:Pa (instant):regular_ll:potentialVorticity:level 2.147485648 K m2 kg-1 s-1:fcst time 48 hrs:from 202212240000
743:Vertical speed shear:s**-1 (instant):regular_ll:potentialVorticity:level 2.147485648 K m2 kg-1 s23-01-26 22:2623-01-26 22:26:023-01-26 22:26:23-01-26 2223-01-23-232222
実にいろいろな情報が利用可能であることがわかります。例えば,最初の行に表示されているものは,平均海面高度の値に直した気圧のデータがあって,それがどのような単位,どのような格子点のとり方,いつの予報時間,いつの初期時刻のものなのかなどの情報を教えてくれています。
前回の記事では詳しく触れませんでしたが,このようなデータの中から,select(<条件>) メソッドで条件を指定すると,条件に合致するものを選び出してくれるわけです。条件に合致するものが複数個ある可能性があるため,リストが返ってきます。そのため,select(<条件>)[0] で条件に合致するもののうち最初のもの(前回の場合は条件にマッチするものは1つしかなかったはずです)を選びます。
そのようにして得られたインスタンスに data(<緯度経度の範囲>) メソッドを適用すると,指定した緯度経度の範囲内にあるデータを取り出すことができます。
さて,上の出力結果を眺めてみると,
1:Pressure reduced to MSL:Pa (instant):regular_ll:meanSea:level 0:fcst time 72 hrs:from 202301220000
...
588:10 metre U wind component:m s**-1 (instant):regular_ll:heightAboveGround:level 10 m:fcst time 48 hrs:from 202212240000
589:10 metre V wind component:m s**-1 (instant):regular_ll:heightAboveGround:level 10 m:fcst time 48 hrs:from 202212240000
...
596:Total Precipitation:kg m**-2 (accum):regular_ll:surface:level 0:fcst time 42-48 hrs (accum):from 202212240000
597:Total Precipitation:kg m**-2 (accum):regular_ll:surface:level 0:fcst time 0-48 hrs (accum):from 202212240000
となっています。これらのデータを取り出して,地上天気図のようなものを描いてみたいと思います。
地上天気図もどきの描画プログラムの実装
以上述べたことを基に,平均海面高度の気圧,積算降水量,地表付近の風をプロットするプログラムをpythonでコーディングしてみます。以下に実装例を示します。
このプログラムをplot-gfs-wnd-mslp-prcp.pyとして,データをダウンロードしたディレクトリ(~/Desktop/LabCode/python/gfs-wnd-mslp-prcp)に保存します。
import datetime
import os

import pygrib
import cartopy.crs as ccrs
import cartopy.feature as cfeature
import matplotlib as mpl
from matplotlib.colors import ListedColormap, LinearSegmentedColormap
import matplotlib.pyplot as plt
import matplotlib.patheffects as path_effects
from metpy.units import units
import metpy.calc as mpcalc
import numpy as np
import scipy.ndimage as ndimage


#------------------------------------------------------------------------------
# 読み込むデータのファイルパス
fname_gfs = "gfs_4_20221224_0000_048.grb2"

# 最大,最小の緯度と経度
lon_min = 90
lon_max = 180
lat_min = 10
lat_max = 70

#------------------------------------------------------------------------------
# NOAA GFS 予報データの読み込みと平滑化など
# データの読み込み
print("*** GFSデータを読み込みます:", fname_gfs)
with pygrib.open(fname_gfs) as gribin:
    # 地上気圧
    mslp, lat, lon = gribin.select(name='Pressure reduced to MSL')[0].data(lat1=lat_min, lat2=lat_max, lon1=lon_min, lon2=lon_max)

    # 初期値の日付と予報時間
    dtm_ini_gfs = gribin.select(name='Pressure reduced to MSL')[0].analDate
    dtm_fcst_gfs = gribin.select(name='Pressure reduced to MSL')[0].validDate

    # 予報時間を計算
    fcst_hrs = dtm_fcst_gfs - dtm_ini_gfs

    # 地上10mの風
    uwnd_10m, _, _ = gribin.select(name='10 metre U wind component')[0].data(lat1=lat_min, lat2=lat_max, lon1=lon_min, lon2=lon_max)
    vwnd_10m, _, _ = gribin.select(name='10 metre V wind component')[0].data(lat1=lat_min, lat2=lat_max, lon1=lon_min, lon2=lon_max)

    # 前6時間雨量
    prcp, _, _ = gribin.select(name='Total Precipitation', forecastTime=fcst_hrs/datetime.timedelta(hours=1)-6)[0].data(lat1=lat_min, lat2=lat_max, lon1=lon_min, lon2=lon_max)


# ガウシアンフィルタで平滑化する
mslp = ndimage.gaussian_filter(mslp, sigma=1.0)
uwnd_10m = ndimage.gaussian_filter(uwnd_10m, sigma=1.0)
vwnd_10m = ndimage.gaussian_filter(vwnd_10m, sigma=1.0)
prcp = ndimage.gaussian_filter(prcp, sigma=1.0)

# 単位をつける
mslp = mslp * units('Pa')
lat = lat * units('degrees_north')
lon = lon * units('degrees_east')
uwnd_10m = uwnd_10m * units('m/s')
vwnd_10m = vwnd_10m * units('m/s')
prcp = prcp * units('kg m**-2')


#------------------------------------------------------------------------------
# プロット
fig = plt.figure(figsize=(210/25.4, 294/25.4), dpi=100)
out_fig_path = f'plot-gfs-ini{dtm_ini_gfs.strftime("%Y%m%d%H")}-fcst{dtm_fcst_gfs.strftime("%Y%m%d%H")}-mslp-prcp.png'

fig.text(0.10, 0.97, f"NOAA GFS (resolution 0.5 deg)", fontsize=12)
fig.text(0.10, 0.95, f"initial: {dtm_ini_gfs.strftime('%Y/%m/%d %H')}UTC", fontsize=12)
fig.text(0.10, 0.93, f"forecast: {dtm_fcst_gfs.strftime('%Y/%m/%d %H')}UTC (initial + {fcst_hrs/datetime.timedelta(hours=1)}hrs)", fontsize=12)

# 地図用の変換
crs_map = ccrs.NorthPolarStereo(central_longitude=140.0, true_scale_latitude=60.0) # 気象庁「日々の天気図」に近いもの

# データ用の変換
crs_data = ccrs.PlateCarree()

# プロット枠の設定
ax01 = fig.add_axes([0.10, 0.50, 0.80, 0.40], projection=crs_map)
cb01 = fig.add_axes([0.80, 0.50, 0.01, 0.40])
ax02 = fig.add_axes([0.10, 0.05, 0.80, 0.40], projection=crs_map)
cb02 = fig.add_axes([0.80, 0.05, 0.01, 0.40])


# ----- プロット その1 地上10mの風
# 海岸線や国境を描画する
ax01.add_feature(cfeature.COASTLINE, linewidth=0.5, color="green")
# cfeature.LANDはデフォルトでzorder=-1となり,思ったようにプロットできないので,NaturalEarthFeatureを使う。
ax01.add_feature(cfeature.NaturalEarthFeature('physical', 'land', '50m', facecolor='green'), alpha=0.1)
ax01.add_feature(cfeature.BORDERS, linewidth=0.5, linestyle=':', color="black")

# 地図を描く緯度経度の範囲の設定
ax01.set_extent([117.0, 156.0, 18.0, 61.0], crs_data)

# 地上10mの風
wndsp_10m = mpcalc.wind_speed(uwnd_10m, vwnd_10m).to(units.knots) # 風速の計算
clevs_wndsp = np.array([0, 10, 20, 30, 40, 50])
norm = mpl.colors.Normalize(vmin=clevs_wndsp.min(), vmax=clevs_wndsp.max())

ax01.barbs(lon[::5, ::5], lat[::5, ::5], uwnd_10m[::5, ::5].to(units.knots), vwnd_10m[::5, ::5].to(units.knots),
           length=4, transform=crs_data, sizes=dict(emptybarb=0.04), linewidth=0.4, pivot='middle')
st = ax01.streamplot(lon, lat, uwnd_10m.to(units.knots), vwnd_10m.to(units.knots),
                density=[1, 1],
                color=wndsp_10m.magnitude, transform=crs_data,
                linewidth=1.0,
                cmap='jet', norm=norm)

mpl.colorbar.ColorbarBase(cb01, st.lines, ticks=clevs_wndsp,
                          orientation='vertical',
                          label=u'10m wind (kt)',
                          ).minorticks_off()

# グリッドを描く
ax01.gridlines(xlocs=np.arange(100, 180, 10),
               ylocs=np.arange(10, 90, 10),
               linestyle='dashed', color='green', linewidth=0.5)


# ----- プロット その2 地上気圧と前6時間積算降水量
# 海岸線や国境を描画する
ax02.add_feature(cfeature.COASTLINE, linewidth=0.5, color="green")
# cfeature.LANDはデフォルトでzorder=-1となり,思ったようにプロットできないので,NaturalEarthFeatureを使う。
ax02.add_feature(cfeature.NaturalEarthFeature('physical', 'land', '50m', facecolor='green'), alpha=0.1)
ax02.add_feature(cfeature.BORDERS, linewidth=0.5, linestyle=':', color="black")

# 地図を描く緯度経度の範囲の設定
ax02.set_extent([117.0, 156.0, 18.0, 61.0], crs_data)

# 地上気圧
clevs_mslp = np.arange(800, 1200, 4)
cs = ax02.contour(lon, lat, mslp.to(units('hPa')), clevs_mslp,
                  colors='black', transform=crs_data, linewidths=[1.25, 0.75, 0.75, 0.75, 0.75])
clbls = ax02.clabel(cs, clevs_mslp[::2], fmt='%d')
plt.setp(clbls, path_effects=[path_effects.withStroke(linewidth=2, foreground="w")])

fig.text(0.10, 0.03, "pressure reduced to MSL (hPa)", fontsize=12)

# --- 地上気圧の極小極大を探す
neighborhood_size = 10
mslp_max = ndimage.maximum_filter(np.array(mslp), neighborhood_size)
is_maxima = (np.array(mslp) == mslp_max)
mslp_min = ndimage.minimum_filter(np.array(mslp), neighborhood_size)
is_minima = (np.array(mslp) == mslp_min)

# 極大値にHマークをつける
for i in range(is_maxima.shape[0]):
    for j in range(is_maxima.shape[1]):
        if is_maxima[i, j]:
            ax02.text(lon[i, j], lat[i, j], 'H', transform=crs_data, clip_on=True, color='blue',
                va='center', ha='center', weight='bold',
                path_effects=[path_effects.Stroke(linewidth=2, foreground='white'),
                              path_effects.Normal()],
                fontsize=12)

# 極小値にLマークをつける
for i in range(is_minima.shape[0]):
    for j in range(is_minima.shape[1]):
        if is_minima[i, j]:
            ax02.text(lon[i, j], lat[i, j], 'L', transform=crs_data, clip_on=True, color='red',
                va='center', ha='center', weight='bold',
                path_effects=[path_effects.Stroke(linewidth=2, foreground='white'),
                              path_effects.Normal()],
                fontsize=12)

# 前6時間降水量
# 気象庁-likeなカラーマップを使用する
# 参考:
# https://qiita.com/earth06/items/eb579d122bb67d964c40
# https://seesaawiki.jp/met-python/d/matplotlib/plot#content_7_11
jmacolors=np.array(
   [
    [242,242,255,  1],
    [160,210,255,  1],
    [33 ,140,255,  1],
    [0  ,65 ,255,  1],
    [250,245,  0,  1],
    [255,153,  0,  1],
    [255, 40,  0,  1],
    [180,  0,104, 1]], dtype=np.float64
)
jmacolors[:, :3] = jmacolors[:, :3]/256.0
jmacmap = ListedColormap(jmacolors)
jmacmap2 = LinearSegmentedColormap.from_list("jmacmap2",colors=jmacolors)

clevs_prcp_srf = np.array([0.1, 1, 5, 10, 20, 30, 50, 80])
norm = mpl.colors.BoundaryNorm([0.1, 1, 5, 10, 20, 30, 50, 80, 100], 256)
cf = ax02.contourf(lon, lat, prcp, clevs_prcp_srf, norm=norm,
                   cmap=jmacmap2, transform=crs_data, extend='max')
mpl.colorbar.ColorbarBase(cb02, cf, ticks=clevs_prcp_srf,
                          orientation='vertical',
                          label=u'6 hours accumulated precipitation (mm)',
                          ).minorticks_off()

ax02.contour(lon, lat, prcp, [0.1],
             colors='black', transform=crs_data, linewidths=0.25, linestyles='dashed')


# グリッドを描く
ax02.gridlines(xlocs=np.arange(100, 180, 10),
               ylocs=np.arange(10, 90, 10),
               linestyle='dashed', color='green', linewidth=0.5)


#------------------------------------------------------------------------------
# 図の保存
plt.savefig(out_fig_path, transparent=False)
プログラムを試してみる前に
#------------------------------------------------------------------------------
# 読み込むデータのファイルパス
fname_gfs = "gfs_4_20221224_0000_048.grb2"
17行目から19行目の部分は読み込むデータのファイルパスを設定する部分ですが,例示のために示してあります。自分がダウンロードしてきたデータのファイル名を指定してください。
プログラムを実行する
ターミナルを開き,
$ cd ~/Desktop/LabCode/python/gfs-wnd-mslp-prcpと入力し,先程プログラムを保存したディレクトリに移動します。あとは以下のコマンドで plot-gfs-wnd-mslp-prcp.pyを実行するだけです。( $マークは「プロンプト」です。入力する必要はありません。)
$ python3 plot-gfs-wnd-mslp-prcp.py実行結果
~/Desktop/LabCode/python/gfs-wnd-mslp-prcp にplot-gfs-ini2022122400-fcst2022122600-mslp-prcp.pngというファイルができて,以下のようになっていれば成功です!

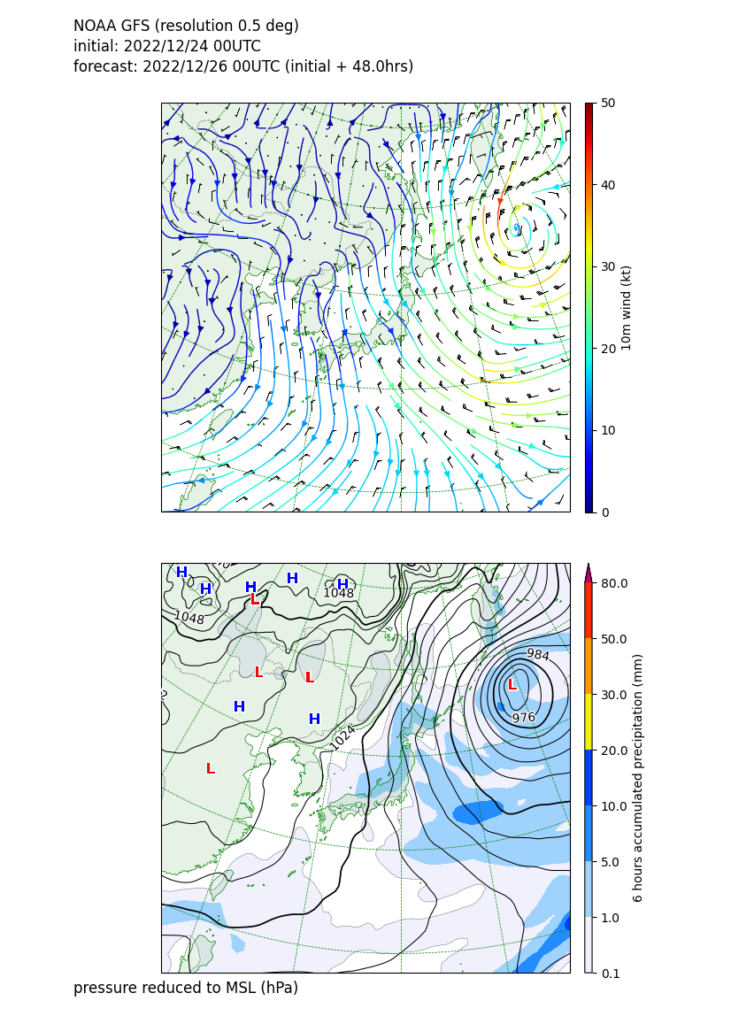
一段目は風の情報をプロットしています。各地点での風向と風速を矢羽で表現しています。また,流線で風の流れを示し,流線の色は風速を表現しています。大陸から北寄りの風が日本列島に吹きつけていて,千島の東には低気圧に伴う渦がみられます。
二段目は平均海面高度の気圧と予報時間前6時間の積算降水量です。大陸には高気圧,千島の東の海上には発達した低気圧あって冬型の気圧配置になると予想されていたことがわかります。
低気圧の周辺と日本海を通ってきた大陸からの寒気が吹きつける本州の日本海側には降雨域が予想されていました。
低気圧の位置には赤の L の文字が,高気圧の位置には青の H の文字が置かれています。
コードの解説
上に書いたソースコードの解説をしていきます。
import datetime
import os

import pygrib
import cartopy.crs as ccrs
import cartopy.feature as cfeature
import matplotlib as mpl
from matplotlib.colors import ListedColormap, LinearSegmentedColormap
import matplotlib.pyplot as plt
import matplotlib.patheffects as path_effects
from metpy.units import units
import metpy.calc as mpcalc
import numpy as np
import scipy.ndimage as ndimage
まず,必要なモジュールをインポートします。
#------------------------------------------------------------------------------
# 読み込むデータのファイルパス
fname_gfs = "gfs_4_20221224_0000_048.grb2"

# 最大,最小の緯度と経度
lon_min = 90
lon_max = 180
lat_min = 10
lat_max = 70
ここでは,読み込みデータのファイル名を指定します。ダウンロードしたファイル名に合わせて変更してください。
また,描画したい緯度と経度の範囲を指定します。日本域以外をプロットしたい場合は適宜変えてください。
#------------------------------------------------------------------------------
# NOAA GFS 予報データの読み込みと平滑化など
# データの読み込み
print("*** GFSデータを読み込みます:", fname_gfs)
with pygrib.open(fname_gfs) as gribin:
    # 地上気圧
    mslp, lat, lon = gribin.select(name='Pressure reduced to MSL')[0].data(lat1=lat_min, lat2=lat_max, lon1=lon_min, lon2=lon_max)

    # 初期値の日付と予報時間
    dtm_ini_gfs = gribin.select(name='Pressure reduced to MSL')[0].analDate
    dtm_fcst_gfs = gribin.select(name='Pressure reduced to MSL')[0].validDate

    # 予報時間を計算
    fcst_hrs = dtm_fcst_gfs - dtm_ini_gfs

    # 地上10mの風
    uwnd_10m, _, _ = gribin.select(name='10 metre U wind component')[0].data(lat1=lat_min, lat2=lat_max, lon1=lon_min, lon2=lon_max)
    vwnd_10m, _, _ = gribin.select(name='10 metre V wind component')[0].data(lat1=lat_min, lat2=lat_max, lon1=lon_min, lon2=lon_max)

    # 前6時間雨量
    prcp, _, _ = gribin.select(name='Total Precipitation', forecastTime=fcst_hrs/datetime.timedelta(hours=1)-6)[0].data(lat1=lat_min, lat2=lat_max, lon1=lon_min, lon2=lon_max)


# ガウシアンフィルタで平滑化する
mslp = ndimage.gaussian_filter(mslp, sigma=1.0)
uwnd_10m = ndimage.gaussian_filter(uwnd_10m, sigma=1.0)
vwnd_10m = ndimage.gaussian_filter(vwnd_10m, sigma=1.0)
prcp = ndimage.gaussian_filter(prcp, sigma=1.0)

# 単位をつける
mslp = mslp * units('Pa')
lat = lat * units('degrees_north')
lon = lon * units('degrees_east')
uwnd_10m = uwnd_10m * units('m/s')
vwnd_10m = vwnd_10m * units('m/s')
prcp = prcp * units('kg m**-2')pygribを使って,GFSデータの読み込みをします。select(<条件>) メソッドで条件にマッチするインスタンスを取得し,data(<緯度経度の範囲>)として,指定した緯度経度の範囲の値,緯度,経度を返します。
上で実行した [print-gfs-data.py](<http://print-gfs-data.py>) の結果から,ほしいデータをname で指定します。条件を満たすもののうち,1つ目のデータを使用するため,select(<条件>)[0].data(<緯度経度の範囲>)とします。
なお,地上気圧と風は nameを指定するだけでデータが一つに決まりますが,積算降水量は決まりません。これは,name='Total Precipitation'にマッチするものとして,初期時刻からの積算降水量と前6時間の積算降水量があるからです。したがって,追加の条件としてforecastTimeを指定すると,一つに定まります。
インスタンスに対して,analDate を適用すると初期時刻が,validDateを適用すると予報時間がdatetime.datetime オブジェクトとして返ってきます。
前回と同じように,ガウシアンフィルタでデータを平滑化し,単位を付けておきます。
#------------------------------------------------------------------------------
# プロット
fig = plt.figure(figsize=(210/25.4, 294/25.4), dpi=100)
out_fig_path = f'plot-gfs-ini{dtm_ini_gfs.strftime("%Y%m%d%H")}-fcst{dtm_fcst_gfs.strftime("%Y%m%d%H")}-mslp-prcp.png'

fig.text(0.10, 0.97, f"NOAA GFS (resolution 0.5 deg)", fontsize=12)
fig.text(0.10, 0.95, f"initial: {dtm_ini_gfs.strftime('%Y/%m/%d %H')}UTC", fontsize=12)
fig.text(0.10, 0.93, f"forecast: {dtm_fcst_gfs.strftime('%Y/%m/%d %H')}UTC (initial + {fcst_hrs/datetime.timedelta(hours=1)}hrs)", fontsize=12)

# 地図用の変換
crs_map = ccrs.NorthPolarStereo(central_longitude=140.0, true_scale_latitude=60.0) # 気象庁「日々の天気図」に近いもの

# データ用の変換
crs_data = ccrs.PlateCarree()

# プロット枠の設定
ax01 = fig.add_axes([0.10, 0.50, 0.80, 0.40], projection=crs_map)
cb01 = fig.add_axes([0.80, 0.50, 0.01, 0.40])
ax02 = fig.add_axes([0.10, 0.05, 0.80, 0.40], projection=crs_map)
cb02 = fig.add_axes([0.80, 0.05, 0.01, 0.40])
図の設定をしています。データから取得した初期時刻と予報時間をファイル名につけるようにし,図にも書くようにします。
# ----- プロット その1 地上10mの風
# 海岸線や国境を描画する
ax01.add_feature(cfeature.COASTLINE, linewidth=0.5, color="green")
# cfeature.LANDはデフォルトでzorder=-1となり,思ったようにプロットできないので,NaturalEarthFeatureを使う。
ax01.add_feature(cfeature.NaturalEarthFeature('physical', 'land', '50m', facecolor='green'), alpha=0.1)
ax01.add_feature(cfeature.BORDERS, linewidth=0.5, linestyle=':', color="black")

# 地図を描く緯度経度の範囲の設定
ax01.set_extent([117.0, 156.0, 18.0, 61.0], crs_data)

# 地上10mの風
wndsp_10m = mpcalc.wind_speed(uwnd_10m, vwnd_10m).to(units.knots) # 風速の計算
clevs_wndsp = np.array([0, 10, 20, 30, 40, 50])
norm = mpl.colors.Normalize(vmin=clevs_wndsp.min(), vmax=clevs_wndsp.max())

ax01.barbs(lon[::5, ::5], lat[::5, ::5], uwnd_10m[::5, ::5].to(units.knots), vwnd_10m[::5, ::5].to(units.knots),
           length=4, transform=crs_data, sizes=dict(emptybarb=0.04), linewidth=0.4, pivot='middle')
st = ax01.streamplot(lon, lat, uwnd_10m.to(units.knots), vwnd_10m.to(units.knots),
                density=[1, 1],
                color=wndsp_10m.magnitude, transform=crs_data,
                linewidth=1.0,
                cmap='jet', norm=norm)

mpl.colorbar.ColorbarBase(cb01, st.lines, ticks=clevs_wndsp,
                          orientation='vertical',
                          label=u'10m wind (kt)',
                          ).minorticks_off()

# グリッドを描く
ax01.gridlines(xlocs=np.arange(100, 180, 10),
               ylocs=np.arange(10, 90, 10),
               linestyle='dashed', color='green', linewidth=0.5)
一段目の地上10mの風のデータをプロットしているところです。
MetPyのmetpy.calc.wind_speed()関数は東西風と南北風を入力にして,風速を計算してくれる関数です。
ax01.barb() で矢羽をプロットします。lon[::5, ::5]などとして,すべてのデータに対してプロットするのではなく,格子点5つおきにプロットします。pivot = “middle” は矢羽の中心が対応する緯度経度の位置であるようにプロットさせるためにつけます。デフォルトは,矢羽の先端が対応する緯度経度の位置に置かれてしまいます。
ax01.streamplot() で流線をプロットします。color=wndsp_10m.magnitude とすると,風速に応じて流線の色を変えることができます。
density=[1, 1] は流線の密度を変更できるオプションです。値を大きくすると,よりたくさんの流線が描かれます。
# ----- プロット その2 地上気圧と前6時間積算降水量と地上10mの風
# 海岸線や国境を描画する
ax02.add_feature(cfeature.COASTLINE, linewidth=0.5, color="green")
# cfeature.LANDはデフォルトでzorder=-1となり,思ったようにプロットできないので,NaturalEarthFeatureを使う。
ax02.add_feature(cfeature.NaturalEarthFeature('physical', 'land', '50m', facecolor='green'), alpha=0.1)
ax02.add_feature(cfeature.BORDERS, linewidth=0.5, linestyle=':', color="black")

# 地図を描く緯度経度の範囲の設定
ax02.set_extent([117.0, 156.0, 18.0, 61.0], crs_data)

# 地上気圧
clevs_mslp = np.arange(800, 1200, 4)
cs = ax02.contour(lon, lat, mslp.to(units('hPa')), clevs_mslp,
                  colors='black', transform=crs_data, linewidths=[1.25, 0.75, 0.75, 0.75, 0.75])
clbls = ax02.clabel(cs, clevs_mslp[::2], fmt='%d')
plt.setp(clbls, path_effects=[path_effects.withStroke(linewidth=2, foreground="w")])

fig.text(0.10, 0.03, "pressure reduced to MSL (hPa)", fontsize=12)
二段目の地上気圧をプロットしているところです。
平均海面高度の気圧は,ax02.contour() とし,等高線プロットで実現できます。
通常の天気図に合わせて,4hPaごとに太線で描かせています。これはlinewidths=[1.25, 0.75, 0.75, 0.75, 0.75]) とすれば簡単にできます。
# --- 地上気圧の極小極大を探す
neighborhood_size = 10
mslp_max = ndimage.maximum_filter(np.array(mslp), neighborhood_size)
is_maxima = (np.array(mslp) == mslp_max)
mslp_min = ndimage.minimum_filter(np.array(mslp), neighborhood_size)
is_minima = (np.array(mslp) == mslp_min)

# 極大値にHマークをつける
for i in range(is_maxima.shape[0]):
    for j in range(is_maxima.shape[1]):
        if is_maxima[i, j]:
            ax02.text(lon[i, j], lat[i, j], 'H', transform=crs_data, clip_on=True, color='blue',
                va='center', ha='center', weight='bold',
                path_effects=[path_effects.Stroke(linewidth=2, foreground='white'),
                              path_effects.Normal()],
                fontsize=12)

# 極小値にLマークをつける
for i in range(is_minima.shape[0]):
    for j in range(is_minima.shape[1]):
        if is_minima[i, j]:
            ax02.text(lon[i, j], lat[i, j], 'L', transform=crs_data, clip_on=True, color='red',
                va='center', ha='center', weight='bold',
                path_effects=[path_effects.Stroke(linewidth=2, foreground='white'),
                              path_effects.Normal()],
                fontsize=12)
この部分は,平均海面高度の気圧のデータから,極大値・極小値を見つけてきて,高気圧,低気圧を表すHとLのスタンプを押す部分です。極大値,極小値は scipy.ndimage の maximum_filter と minimum_filterを利用します。is_maxima と is_minima は二次元のndarrayで対応する緯度経度が極大極小に該当すれば,True,そうでなければ False となるものです。
# 前6時間降水量
# 気象庁-likeなカラーマップを使用する
# 参考:
# https://qiita.com/earth06/items/eb579d122bb67d964c40
# https://seesaawiki.jp/met-python/d/matplotlib/plot#content_7_11
jmacolors=np.array(
   [
    [242,242,255,  1],
    [160,210,255,  1],
    [33 ,140,255,  1],
    [0  ,65 ,255,  1],
    [250,245,  0,  1],
    [255,153,  0,  1],
    [255, 40,  0,  1],
    [180,  0,104, 1]], dtype=np.float64
)
jmacolors[:, :3] = jmacolors[:, :3]/256.0
jmacmap = ListedColormap(jmacolors)
jmacmap2 = LinearSegmentedColormap.from_list("jmacmap2",colors=jmacolors)
clevs_prcp_srf = np.array([0.1, 1, 5, 10, 20, 30, 50, 80])
norm = mpl.colors.BoundaryNorm([0.1, 1, 5, 10, 20, 30, 50, 80, 100], 256)
cf = ax02.contourf(lon, lat, prcp, clevs_prcp_srf, norm=norm,
                   cmap=jmacmap2, transform=crs_data, extend='max')
mpl.colorbar.ColorbarBase(cb02, cf, ticks=clevs_prcp_srf,
                          orientation='vertical',
                          label=u'6 hours accumulated precipitation (mm)',
                          ).minorticks_off()

ax02.contour(lon, lat, prcp, [0.1],
             colors='black', transform=crs_data, linewidths=0.25, linestyles='dashed')


# グリッドを描く
ax02.gridlines(xlocs=np.arange(100, 180, 10),
               ylocs=np.arange(10, 90, 10),
linestyle='dashed', color='green', linewidth=0.5)この部分は,降水量を描画している部分です。これは,ax02.contourf() でプロットすることが可能です。降水量は,生データは単位面積あたりの質量 (kg/m^2) となっていますが,水の密度を 1 g/cm^3 とすれば,そのまま単位を mm として表すことができます。
カラーマップは,気象庁の図でよく見るようなものにしています。コードや下の参考サイトに記載のウェブサイト参考にさせていただきました。量と色の対応に関しては気象庁の運用とは異なります(異なるはずです)のでご注意ください。
降水ありなしの境目がわかりにくいので,0.1 mm の等値線をax02.contour()でプロットしています。
#------------------------------------------------------------------------------
# 図の保存
plt.savefig(out_fig_path, transparent=False)
最後に図を保存して終了です。
最後に
前回に引き続き,GPVデータのプロットをしてみました。最初に表示させて見てみたように,他にも様々なデータが利用可能です。皆さんも色々なプロットを試してしみてください!
参考にしたサイト・資料
この記事を書くにあたって,以下のウェブサイトや資料を参考にしました。このような有益な情報や資料を無料で公開しているウェブサイトの管理者や資料を作成された方に感謝を申し上げます。
- 気象庁ホームページにおける気象情報の配色に関する設定指針:https://www.jma.go.jp/jma/kishou/info/colorguide/HPColorGuide_202007.pdf
- 気象関係でよく見るカラーマップをmatplotlibで再現する:https://qiita.com/earth06/items/eb579d122bb67d964c40
- memoring matplotlib/plot**:**https://seesaawiki.jp/met-python/d/matplotlib/plot#content_7_11
Pythonでやってみる気象データ解析の技術書を販売中
¥2,500 → ¥1,500 今なら40%OFF!!
気象の勉強をされている方必読!
気象予報士でもある著者がわかりやすく解説
プログラムを公開しているのでお手元で試せます!


