After becoming accustomed to reanalyzing single cell RNA-seq data from public databases, you might find yourself unsatisfied with only being able to reanalyze data from barcode, feature, and matrix files.
Eventually, you may wish to perform counts from fastq files by yourself. This article will cover how to become self-sufficient in counting using Cell Ranger.
By engaging with this article, let’s broaden the scope of your single cell RNA-seq analysis capabilities!
macOS Monterey (12.4), Quad-Core Intel Core i7, Memory 32GB
Beginner-Friendly Technical Book on Single Cell RNA-seq Analysis Using Public Data Available for Sale
¥3,600 → ¥1,800 50%OFF!!
Easy-to-Understand Explanation for Programming Beginners!
Start Single Cell RNA-seq Analysis with R and Seurat!
What is Cell Ranger?
Cell Ranger is a software suite developed by 10x Genomics for preprocessing and analyzing single-cell RNA sequencing (scRNA-seq) data. It is specialized for analyzing data obtained from scRNA-seq experiments conducted using the Chromium system by 10x Genomics. Referring to the diagram, it pertains to the data processing part that takes place after sequencing. The output from Cell Ranger is utilized for downstream analyses such as dimensionality reduction (e.g., t-SNE or PCA), clustering, and differential expression analysis.
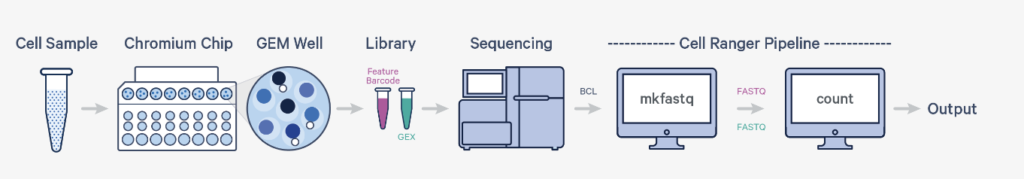
Cell Ranger includes the following key pipelines:
- cellranger mkfastq: Converts raw BCL files, which are directly output from the sequencer, into FASTQ format, a commonly used format in bioinformatics analyses.
- cellranger count: Takes FASTQ files as input and performs read mapping, filtering, and UMI counting (which represents the expression level of each cell and gene) to generate a gene expression matrix for each cell.
- cellranger aggr: Integrates results from multiple cellranger count runs, making it possible to compare these data within the same analytical space.
- cellranger reanalyze: Performs analyses such as clustering and dimensionality reduction with new parameters based on results already obtained from cellranger count or cellranger aggr.
- cellranger multi: Processes and integrates different types of single-cell data (such as RNA-seq, ATAC-seq) simultaneously.
By combining these pipelines, it is possible to manage the entire process from raw sequencing data to analytical results.
This time, I would like to introduce the cellranger mkfastq, cellranger count, and cellranger aggr pipelines, which are likely to be the main ones used, based on the hands-on materials provided by 10X Genomics.
Implementation of Cell Ranger
First, we need to set up an environment to use Cell Ranger.
It’s important to note that Cell Ranger can only be run on a Linux OS. This means it cannot be operated on the Windows or Mac systems that we commonly use. Therefore, on Windows, you would need to install Ubuntu, while on Mac, you would need to run it via Docker. (Of course, you can also use Docker on Windows.)
In this case, we will be using a Docker image to run Cell Ranger on a Mac environment. This discussion assumes that Docker Desktop is already installed. If you are using Windows, please refer to the “Installing Ubuntu” section of this article to install Ubuntu. If you are a Windows user who does not need to prepare a Docker environment, please skip ahead to the “Running cellranger mkfastq” section.
We will install the Cell Ranger Docker image.
docker pull litd/docker-cellranger
Launch the Docker image by clicking on it from the user interface. Then, proceed to start the terminal by pressing the terminal button.
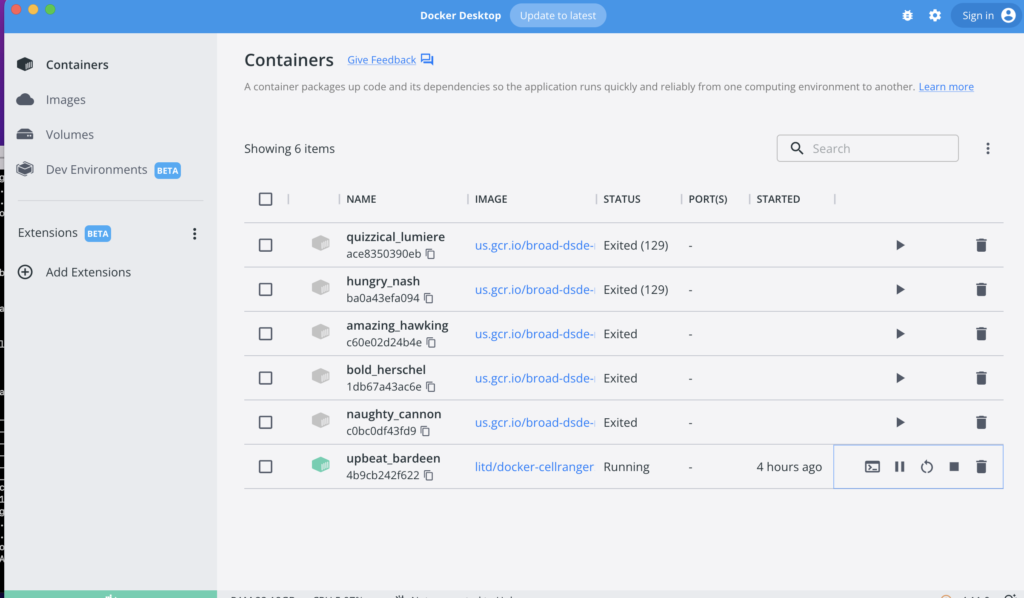
If unable to launch from the user interface, it is also possible to start using the docker run -it command, with the container ID copyable from the user interface.
docker run -it [ee0a61935c4f49f03a18ee3a9c1f8c17e4437dda43ca1b5e9d07577565632(コンテナIDの例です)]
Once launched, please create a directory named ‘yard’. Basic operations will be carried out within this ‘yard’ directory.
mkdir yard
Running cellranger mkfastq
If fastq files are already available from a public database, this step is unnecessary. Otherwise, it is required to create fastq files using mkfastq prior to analysis.
The mkfastq process is executed in two steps:
- Demultiplexing: This is the process of separating multiple samples contained in a single sequencing run. Since each sample has a unique barcode, mkfastq reads these barcodes to accurately identify the reads for each sample.
- Generation of Fastq Files: After demultiplexing, mkfastq uses this information to generate fastq files. Fastq files contain sequencing reads along with their quality scores, which are essential inputs for subsequent sequence analysis, such as read mapping and gene counting.
Now, let’s proceed to run mkfastq. Create a file named run_cellranger_mkfastq and enter it to begin execution.
mkdir /yard/run_cellranger_mkfastq
cd /yard/run_cellranger_mkfastq
Download the sample files and decompress them.
wget https://cf.10xgenomics.com/supp/cell-exp/cellranger-tiny-bcl-1.2.0.tar.gz
wget https://cf.10xgenomics.com/supp/cell-exp/cellranger-tiny-bcl-simple-1.2.0.csv
tar -zxvf cellranger-tiny-bcl-1.2.0.tar.gz
Upon successful decompression, the following set of files is expected to be outputted.
cellranger-tiny-bcl-1.2.0/
cellranger-tiny-bcl-1.2.0/Data/
cellranger-tiny-bcl-1.2.0/Data/Intensities/
cellranger-tiny-bcl-1.2.0/Data/Intensities/BaseCalls/
cellranger-tiny-bcl-1.2.0/Data/Intensities/BaseCalls/L001/
cellranger-tiny-bcl-1.2.0/Data/Intensities/BaseCalls/L001/C25.1/
cellranger-tiny-bcl-1.2.0/Data/Intensities/BaseCalls/L001/C25.1/s_1_1101.bcl.gz
cellranger-tiny-bcl-1.2.0/Data/Intensities/BaseCalls/L001/C1.1/
cellranger-tiny-bcl-1.2.0/Data/Intensities/BaseCalls/L001/C1.1/s_1_1101.bcl.gz
cellranger-tiny-bcl-1.2.0/Data/Intensities/BaseCalls/L001/C2.1/
cellranger-tiny-bcl-1.2.0/Data/Intensities/BaseCalls/L001/C2.1/s_1_1101.bcl.gz
cellranger-tiny-bcl-1.2.0/Data/Intensities/BaseCalls/L001/C3.1/
cellranger-tiny-bcl-1.2.0/Data/Intensities/BaseCalls/L001/C3.1/s_1_1101.bcl.gz
.
.
.
Execute mkfastq with the command below.
cellranger mkfastq --id=tutorial_walk_through \\
  --run=/yard/run_cellranger_mkfastq/cellranger-tiny-bcl-1.2.0 \\
  --csv=/yard/run_cellranger_mkfastq/cellranger-tiny-bcl-simple-1.2.0.csv
If the following output is generated, it indicates success!
sh-4.4# cellranger mkfastq --id=tutorial_walk_through \\
>   --run=/yard/run_cellranger_mkfastq/cellranger-tiny-bcl-1.2.0 \\
>   --csv=/yard/run_cellranger_mkfastq/cellranger-tiny-bcl-simple-1.2.0.csv
/opt/cellranger-7.1.0/bin
cellranger mkfastq (cellranger-7.1.0)
Copyright (c) 2021 10x Genomics, Inc.  All rights reserved.
-------------------------------------------------------------------------------

Martian Runtime - v4.0.10
2023-06-11 11:57:52 [runtime] Reattaching in local mode.
Serving UI at <http://4b9cb242f622:39525?auth=TKb2F_7AUK6OGai2jN2JBiMtSEysYDXQV3OIbXZURdo>

Outputs:
- FASTQ output folder:   /yard/run_cellranger_mkfastq/tutorial_walk_through/outs/fastq_path
- Interop output folder: /yard/run_cellranger_mkfastq/tutorial_walk_through/outs/interop_path
- Input samplesheet:     /yard/run_cellranger_mkfastq/tutorial_walk_through/outs/input_samplesheet.csv

Waiting 6 seconds for UI to do final refresh.
Pipestance completed successfully!

2023-06-11 11:57:58 Shutting down.
Saving pipestance info to "tutorial_walk_through/tutorial_walk_through.mri.tgz"
The created fastq files are stored in /yard/run_cellranger_mkfastq/tutorial_walk_through/outs/fastq_path/H35KCBCXY/test_sample. Use the command below to view them.
cd tutorial_walk_through/outs/fastq_path/H35KCBCXY/test_sample
ls
Fastq files should be visible as expected.
sh-4.4# ls
test_sample_S1_L001_I1_001.fastq.gz  test_sample_S1_L001_R1_001.fastq.gz  test_sample_S1_L001_R2_001.fastq.gz
Running cellranger count
To obtain gene expression counts from fastq files, execute cellranger count. This is a key step in the Cell Ranger pipeline, involving a series of analyses such as read mapping, filtering, barcode counting, and counting of UMI (Unique Molecular Identifier).
First, create and move into the run_cellranger_count directory.
mkdir /yard/run_cellranger_count
cd /yard/run_cellranger_count
Download and decompress the sample files.
wget https://cf.10xgenomics.com/samples/cell-exp/3.0.0/pbmc_1k_v3/pbmc_1k_v3_fastqs.tar
tar -xvf pbmc_1k_v3_fastqs.tar
The cellranger count command requires a reference genome. Download it in the same manner as the sample files.
wget https://cf.10xgenomics.com/supp/cell-exp/refdata-gex-GRCh38-2020-A.tar.gz
tar -zxvf refdata-gex-GRCh38-2020-A.tar.gz
Execute the cellranger count command, specifying the location of the fastq files to be analyzed, the reference genome, and the name of the output directory. This command may take several hours to complete.
cellranger count --id=run_count_1kpbmcs \\
   --fastqs=/yard/run_cellranger_count/pbmc_1k_v3_fastqs \\
   --sample=pbmc_1k_v3 \\
   --transcriptome=/yard/run_cellranger_count/refdata-gex-GRCh38-2020-A
The details of the arguments are as follows:
- -id=run_count_1kpbmcs: Specifies the name of the output directory. In this case, the name of the output folder will be “run_count_1kpbmcs”.
- –fastqs=/yard/run_cellranger_count/pbmc_1k_v3_fastqs: Specifies the path to the directory where the input FASTQ files are stored. In this case, the FASTQ files are located in the “/mnt/home/user.name/yard/run_cellranger_count/pbmc_1k_v3_fastqs” directory.
- –sample=pbmc_1k_v3: Specifies the sample name. The name of the FASTQ files must include this sample name. In this example, it is assumed that the name of the FASTQ files contains “pbmc_1k_v3”.
- –transcriptome=/yard/run_cellranger_count/refdata-gex-GRCh38-2020-A: Specifies the path to the transcriptome reference data to be used. In this case, the reference data is located in the “/mnt/home/user.name/yard/run_cellranger_count/refdata-gex-GRCh38-2020-A” directory.
Upon completion, the results will be stored in the /yard/run_cellranger_count/tutorial_count/outs directory. Let’s check the output files.
cd /yard/run_cellranger_count/tutorial_count/outs
ls
The output results vary depending on each sample and analysis condition, but generally, the following files should be generated:
analysis                    filtered_feature_bc_matrix.h5   metrics_summary.csv
cloupe.cloupe               filtered_feature_bc_matrix      molecule_info.h5
filtered_feature_bc_matrix  possorted_genome_bam.bam        web_summary.html
This directory will include the UMI count matrix for each gene (filtered_feature_bc_matrix), the results of the alignment (possorted_genome_bam.bam), and the results of clustering and dimensionality reduction (cloupe.cloupe), among others.
This completes the execution of cellranger count.
Running cellranger aggr
cellranger aggr is a pipeline for combining the outputs of multiple cellranger count runs (i.e., single-cell RNA-seq data from multiple samples or experiments). This pipeline normalizes each dataset and merges them into a single expression matrix, enabling analysis across multiple samples or conditions. Execute cellranger count as necessary before proceeding.
First, please create a directory named run_cellranger_aggr.
mkdir run_cellranger_aggr
cd run_cellranger_aggr
Download and decompress the sample files.
wget https://cf.10xgenomics.com/samples/cell-exp/3.0.0/pbmc_1k_v3/pbmc_1k_v3_molecule_info.h5
wget https://cf.10xgenomics.com/samples/cell-exp/3.0.0/pbmc_10k_v3/pbmc_10k_v3_molecule_info.h5
For cellranger aggr, it is necessary to create a CSV file listing the file paths to the samples.
Here is an example of an input file (libraries.csv) for aggregating two samples (sample1 and sample2):
Use the vi command to create pbmc_aggr.csv.
vi pbmc_aggr.csv
Create pbmc_aggr.csv listing the file paths for pbmc_1k_v3_molecule_info.h5 and pbmc_10k_v3_molecule_info.h5.
sample_id,molecule_h5
1k_pbmcs,path/to/run_cellranger_aggr/pbmc_1k_v3_molecule_info.h5
10k_pbmcs,path/to/run_cellranger_aggr/pbmc_10k_v3_molecule_info.h5
Then, execute the cellranger aggr command using this CSV file.
cellranger aggr --id=1k_10k_pbmc_aggr --csv=pbmc_aggr.csv
This command will integrate the data from each input sample and output it as a single count matrix. The output files will be stored in the /yard/run_cellranger_aggr/tutorial_aggr/outs directory. Let’s check the output files.
cd /yard/run_cellranger_aggr/tutorial_aggr/outs
ls
The output results will vary depending on the input data and analysis conditions, but generally, the following files should be generated.
analysis filtered_matrices_mex  raw_feature_bc_matrix
cloupe.cloupe raw_feature_bc_matrix.h5 web_summary.html
In Conclusion
Learning how to count from fastq files using Cell Ranger opens the door to not only reanalyzing public databases but also embarking on the journey of analyzing data from scratch. While it may seem daunting at first, it is a crucial step towards enabling unique exploration and discoveries. It is highly encouraged to take on this challenge.
参考
Beginner-Friendly Technical Book on RNA-seq Analysis Using Public Data Available for Sale
¥2,500 → ¥1,500 40%OFF!!
An easy-to-understand guide with abundant screen captures!
Start Dry Research from Your Home PC