
Have you ever wanted to easily conduct image processing and statistical analysis of images for your research?
By using software called ImageJ, you can conveniently perform these tasks, and even automate the processing.
In this article, we will introduce how to install ImageJ and explain some simple image processing operations.
macOS Ventura(13.2.1), Windows11(22H2), ImageJ 1.53
What is ImageJ?
ImageJ is an open-source software developed by the National Institutes of Health (NIH) in the United States, used for image processing and analysis. Additionally, it is not OS dependent and can be operated similarly on Windows, Mac, and Linux.
The representative image processing tasks that can be performed with ImageJ are as follows.
- Preprocessing of images (filtering, smoothing, sharpening, edge extraction, binarization, etc.)
- Measurement of images (length, area, intensity, shape, angle, etc.)
- Image analysis (segmentation, object identification, automatic target detection, etc.)
- Statistical analysis of images (mean, median, standard deviation, correlation analysis, etc.)
These processes can be automated and extended using macros and plugins. Furthermore, there is something called Fiji, which is a package of frequently used plugins for research and can be considered a superior version of ImageJ.
Preparing to Use ImageJ
There are two ways to use ImageJ: installing it locally or launching it in a browser.
Installing ImageJ (as of February 2023)
Go to the following website and download the file that corresponds to your operating system.
https://imagej.nih.gov/ij/download.html
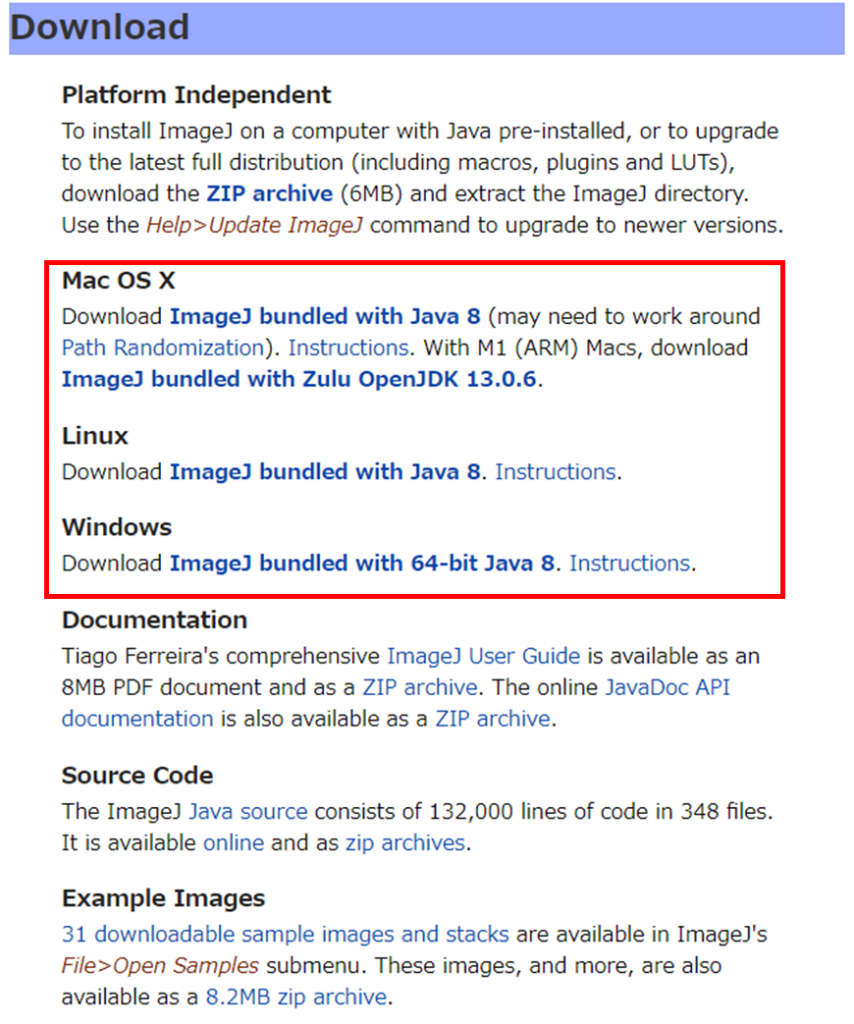
For Windows, you will download a Zip file named ij153-win-java8.zip. Extract this file. Inside the extracted files, you will find a file named ImageJ.exe. Simply click on it to launch the program.
For Mac, if you have an Intel CPU, you will download a file named ij153-osx-java8.zip, or if you have an Apple Silicon such as the M1, you will download a file named ij153-osx-arm-java13.zip. Double click to extract the file. After extraction, an application with an icon named ImageJ.app will be installed.
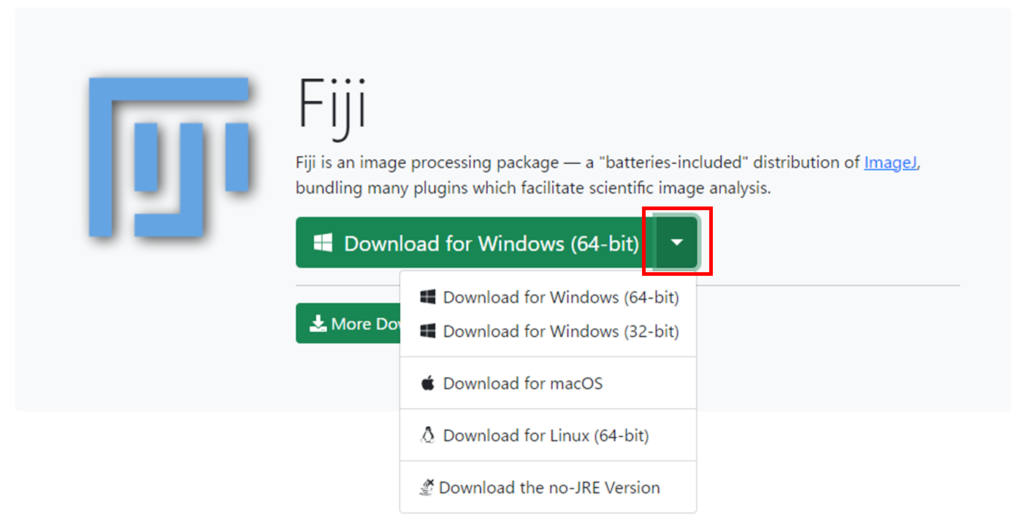
In the case of Fiji
Visit the following website. When you press the down arrow on the right, you can choose the operating system. Download the file that corresponds to your operating system.
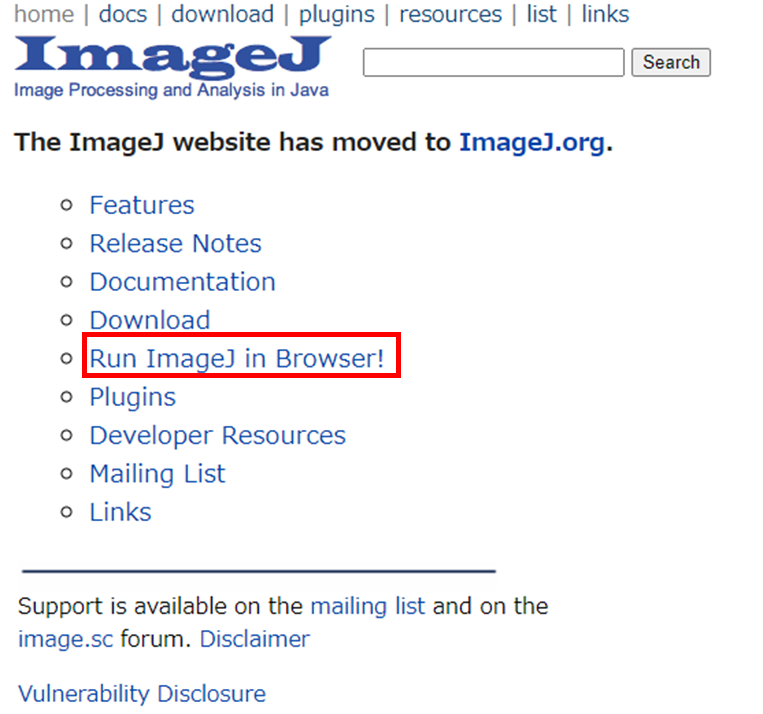
Launching in a Browser
From the ImageJ homepage, click on “Run ImageJ in Browser!”
https://imagej.nih.gov/ij/index.html
After a while, ImageJ will launch and you will be taken to a screen like the one below. Even when launched in a browser, you can use images and macros stored locally for analysis.
In this article, we will be operating ImageJ in a browser and introducing how to perform simple image processing.
Basic Operation of ImageJ
First, prepare the image you will be operating on in ImageJ. ImageJ supports multiple file extensions such as TIFF, GIF, JPEG, PNG, FITS, and DICOM.
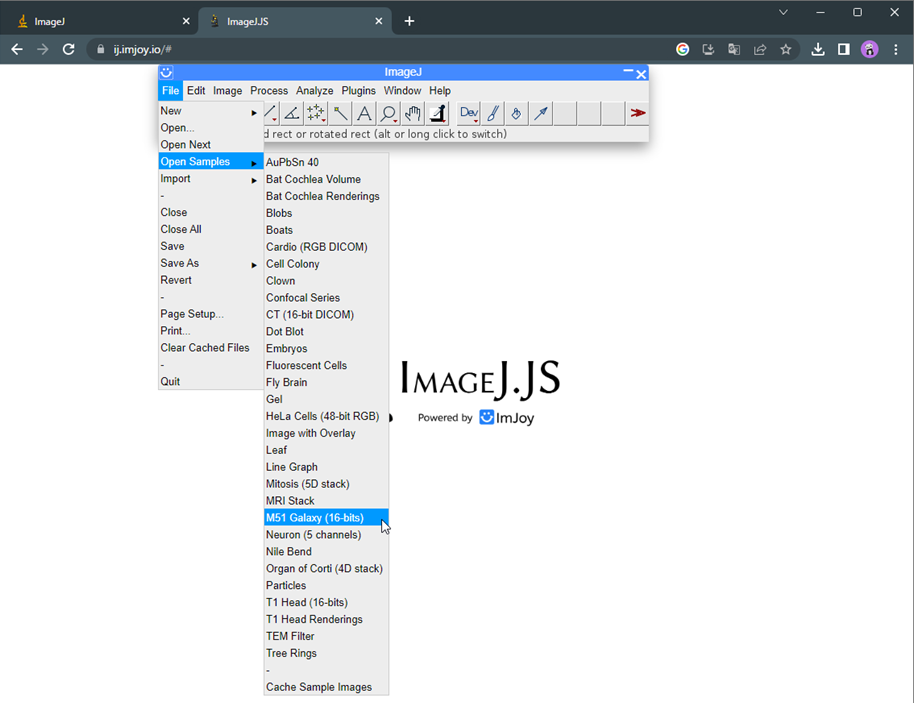
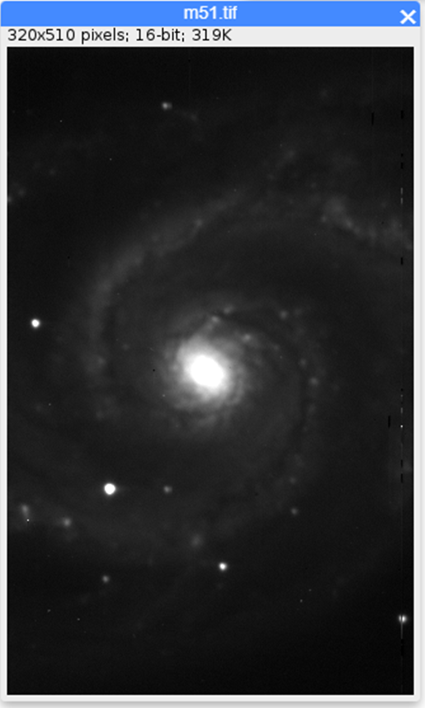
ImageJ provides sample images for practicing operations. Let’s use one of them. From the toolbar, select File > Open Samples > M51 Galaxy (16-bits).
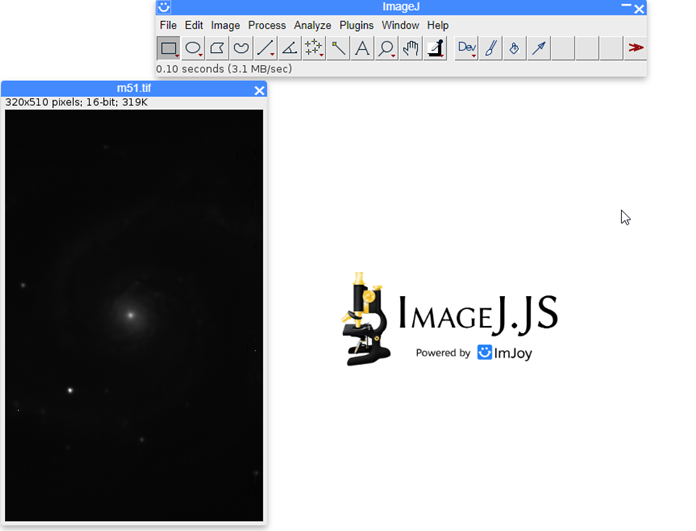
Once selected, an image of white dots will be displayed. It is hard to tell what the image is as it is, so we’ll adjust the contrast.
Adjusting the Contrast
This is a typical way to adjust contrast in image processing. From the toolbar, select Image > Adjust > Brightness/Contrast…
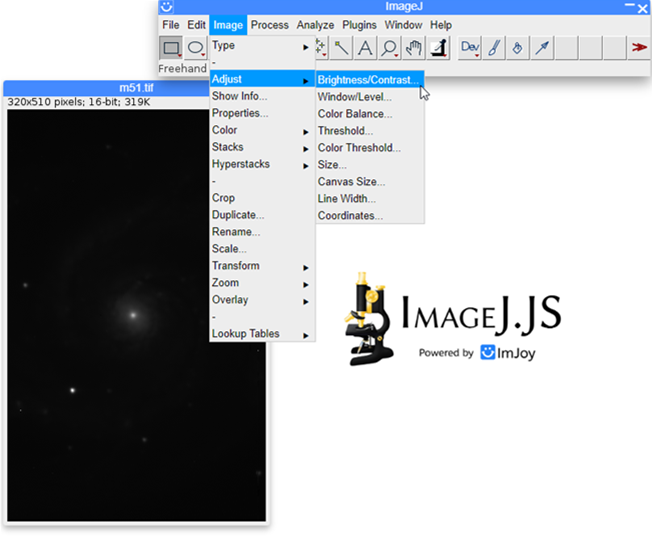
A window named B&C will appear. Adjust the sliders for Minimum and Maximum.
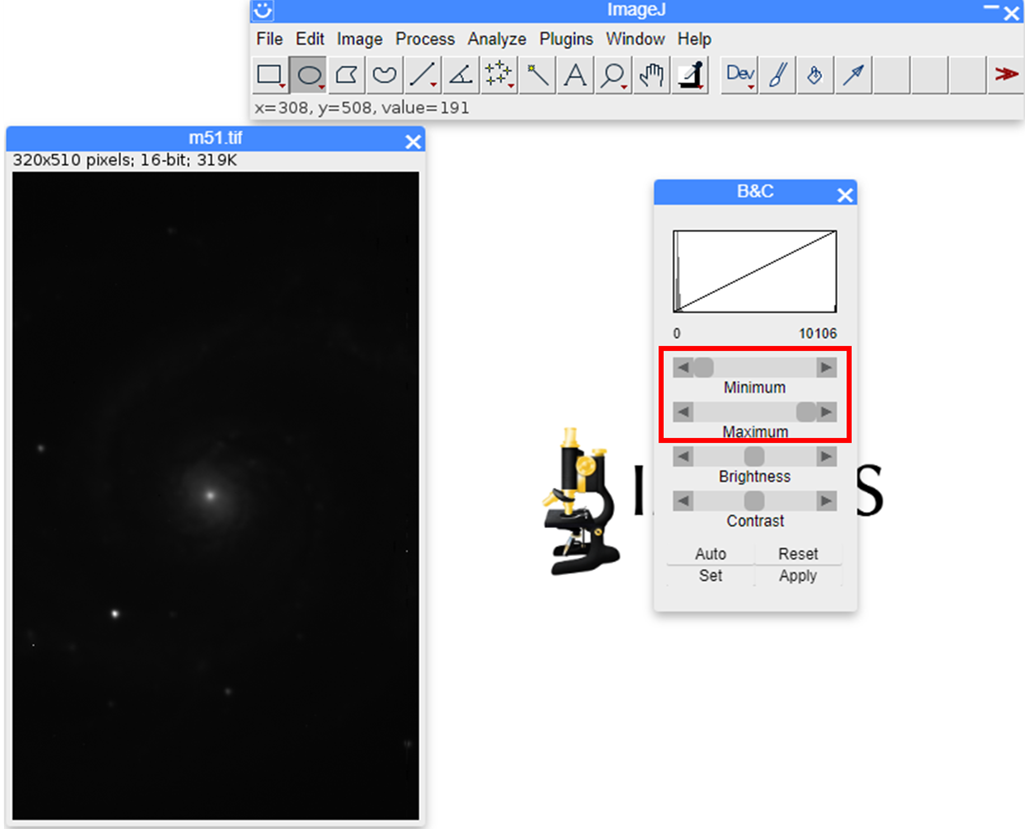
Now you can see the spiral of the galaxy. By changing the contrast like this, you can visualize structures that are not immediately noticeable.
Extracting the Contours of an Image
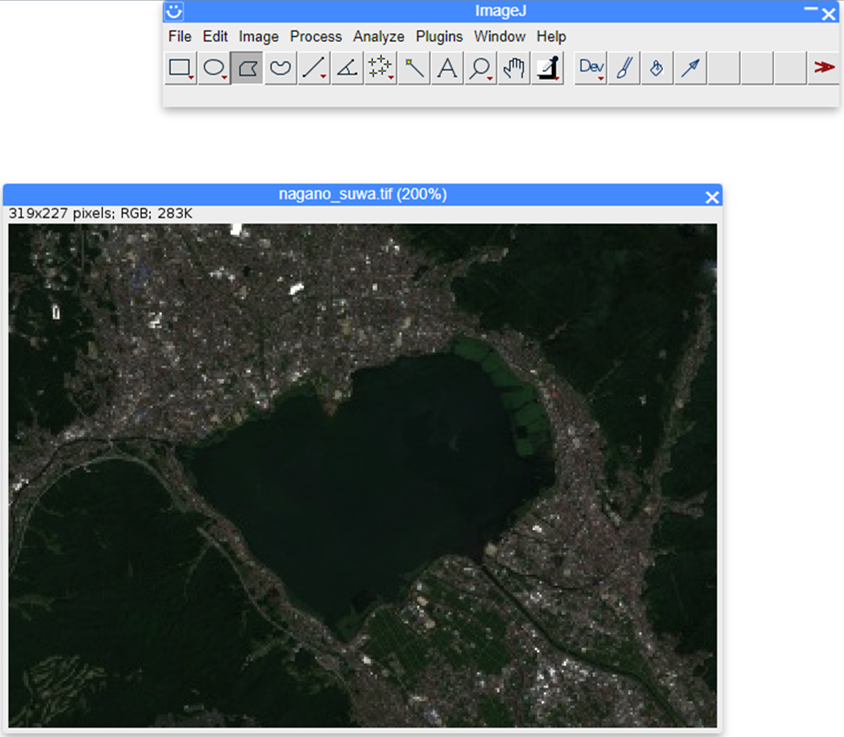
We will use the following image, which is a cutout of Lake Suwa in Nagano Prefecture from an RGB image of satellite data.
The latitude and longitude of Lake Suwa are 36.0595 and 138.0799, respectively.
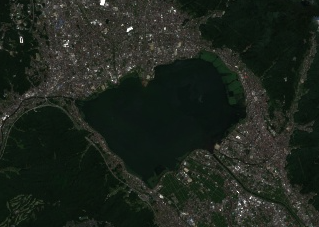
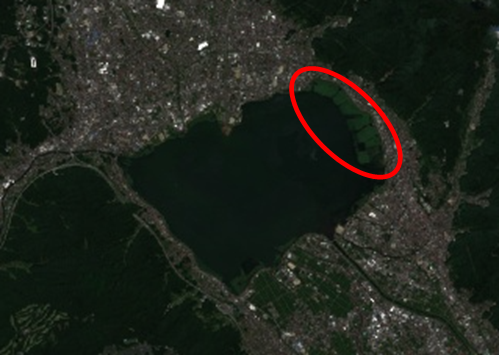
In the northeast part of Lake Suwa, plants flourish on the water surface in the summer. In terms of the image, it’s the area enclosed by the red frame. This time, we will extract the contour of this area.
For the process, we will convert the RGB image to black and white, perform averaging, binarization, and then extract the contours.
First, drag and drop the image file into the browser where you have opened ImageJ.
Next, select Image > Type > 8-bit from the toolbar.
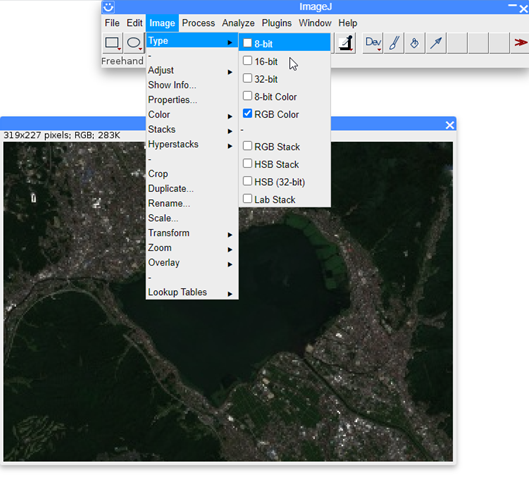
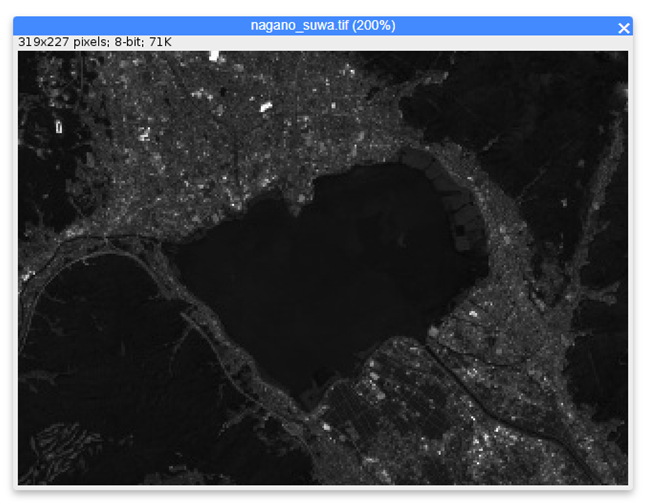
With this operation, the original RGB image has been converted into an 8-bit black and white image.
Next, we will average the image to remove noise. Select Process > Filters > Mean… from the toolbar.
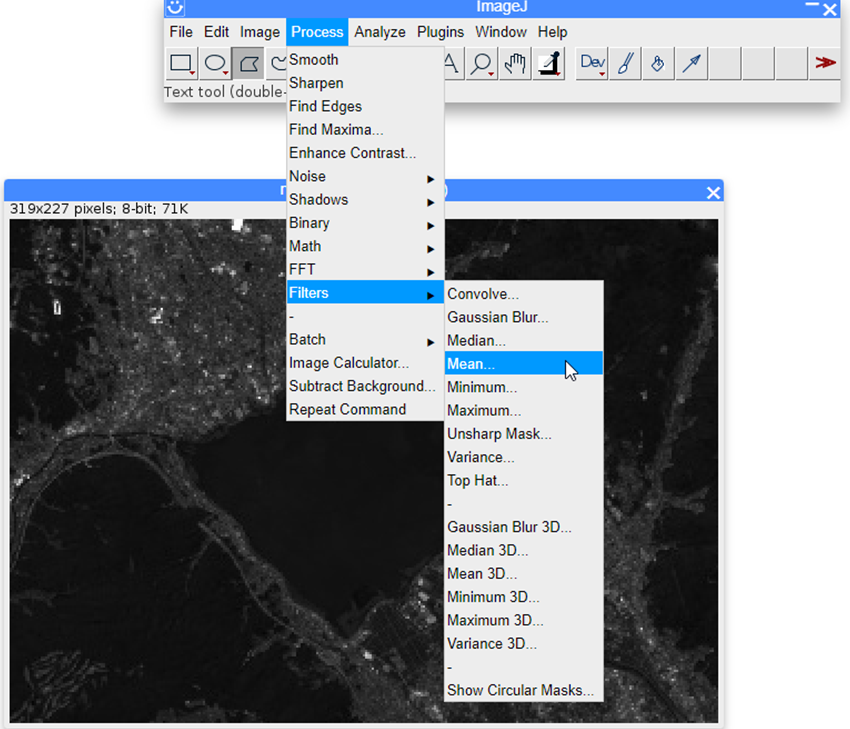
A new window named Mean… will appear. Enter a number there.
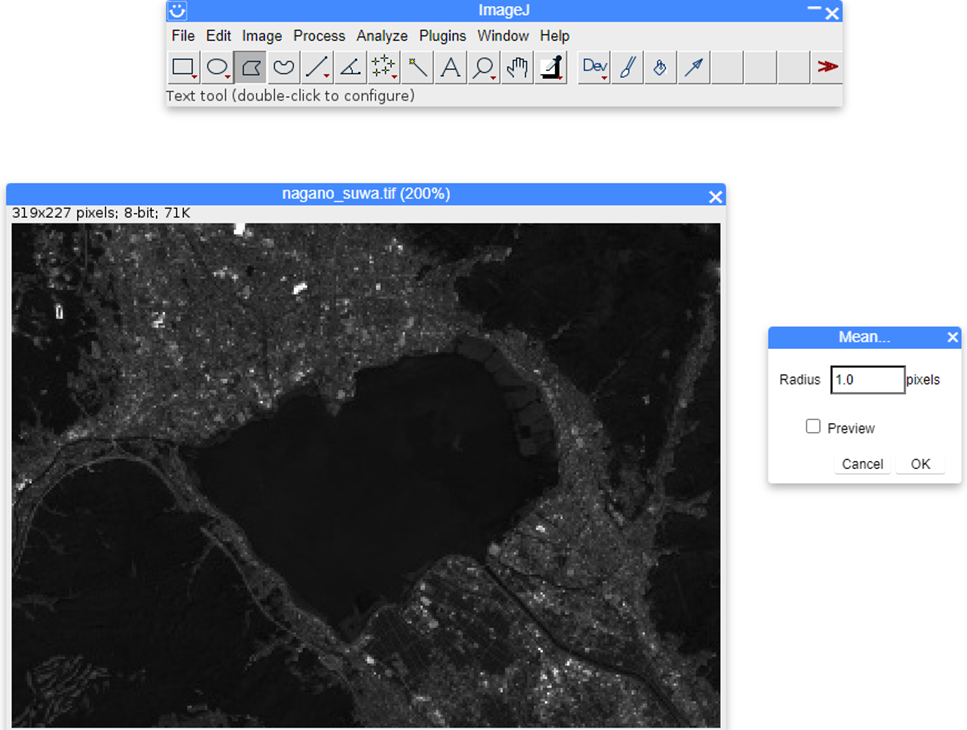
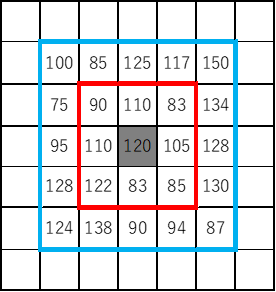
Here, you are setting how many surrounding pixels to use for averaging. For example, if you have image data like the one below, the average for Radius of 1.0 pixels enclosed by the red line is approximately 100, and the average for 2.0 pixels enclosed by the blue line is approximately 108.
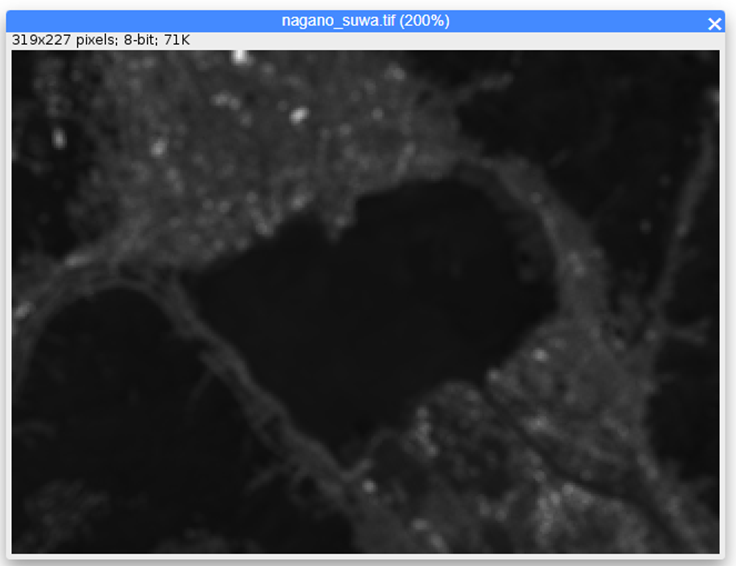
Let’s set it to 2.0 pixels this time. You can see that the image has changed as shown below.
The averaging process is now complete.
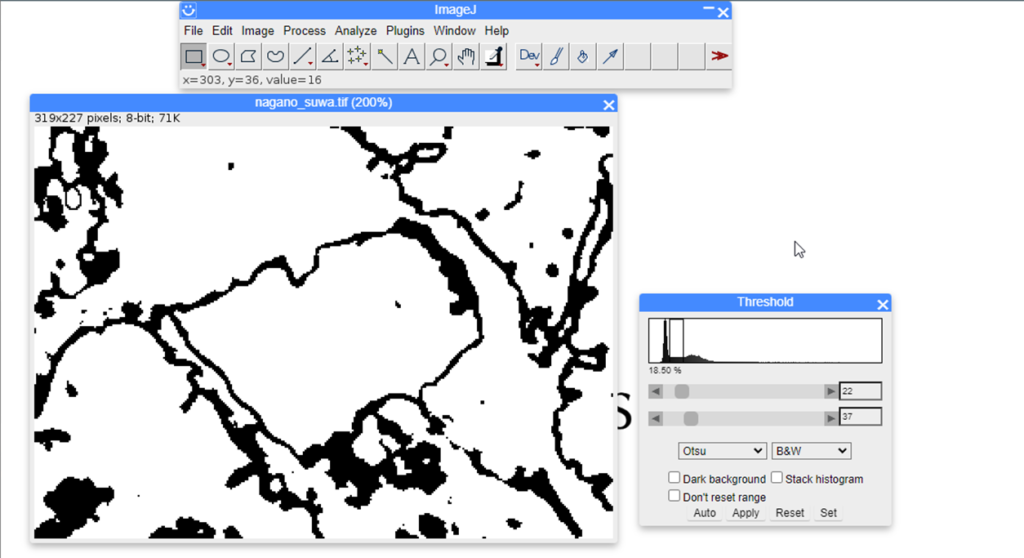
Next, we will perform binarization. Select Image > Adjust > Threshold… from the toolbar.
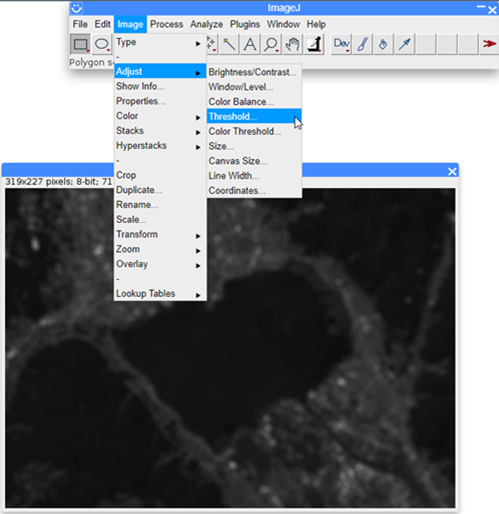
Adjust the threshold in the Threshold window so that the target area turns black.
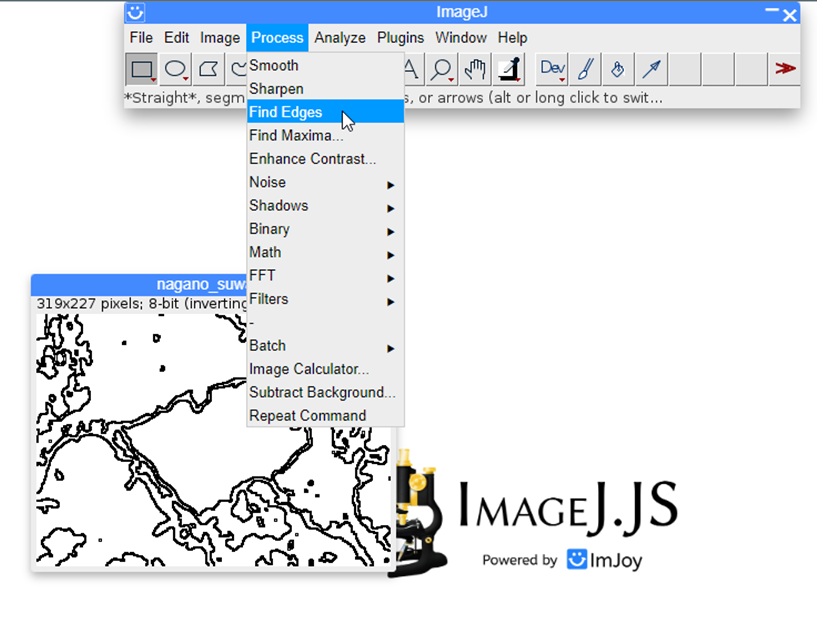
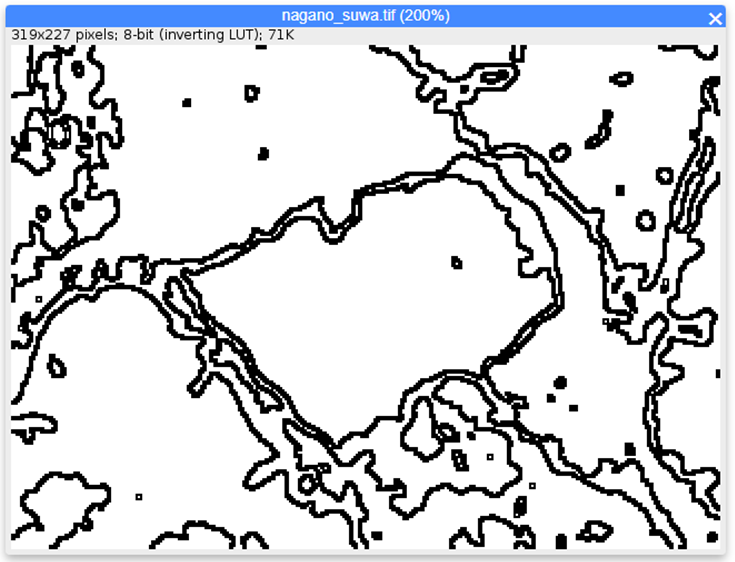
Next, select Process > Find Edges from the toolbar to extract the contours.
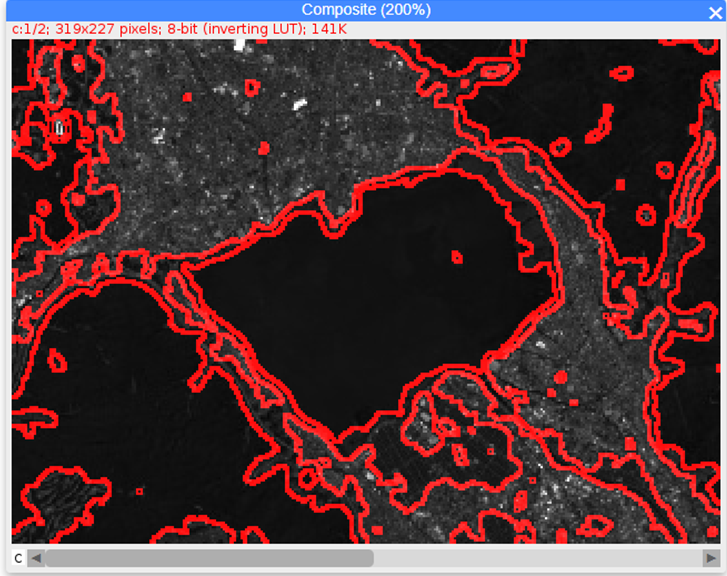
Finally, we will overlay the contours on the original image. Drag and drop the original RGB image again and convert it to an 8-bit black and white image.
Select Image > Color > Merge Channels… from the toolbar and overlay the extracted contours onto the original image. As shown in the figure below, you can see that we have successfully extracted the contours of the area where plants are flourishing in the northeast part of Lake Suwa, as initially expected.
In conclusion
In this article, we introduced a software called ImageJ, which is used for image analysis, and showed how to do some simple image processing. ImageJ allows you to use simple processing programs called macros to automate processes like the ones we introduced in this article. It’s free to use and has many other useful features, so I highly recommend giving it a try.