In this article, we will introduce SAR satellites, which are based on a completely different principle than optical satellites.
Optical satellites observe the earth’s surface by detecting reflected light from the sun. However, due to their nature, observable information is limited to the daytime zone, and information on the earth’s surface can be severely limited under adverse weather conditions.
SAR satellites use microwaves to collect data on the earth’s surface under conditions where optical satellites are not available.
Read this article to get started using SAR satellites.
macOS Ventura(13.2.1), python3.10.9, earthengine-api 0.1.340
What is SAR Satellite?
A SAR satellite is a satellite equipped with Synthetic Aperture Radar (SAR). SAR visualizes the state of the earth’s surface by emitting electromagnetic waves (microwaves) toward the surface and receiving and analyzing the reflected waves.
Unlike ordinary optical satellites, these satellites do not image reflections in visible or near-infrared light, making it possible to observe 24 hours a day, even at night when there is no sunlight on the earth’s surface or in bad weather conditions. This makes it possible to observe areas of interest on a regular basis. It also opens up the possibility of assessing the situation in the event of a disaster.
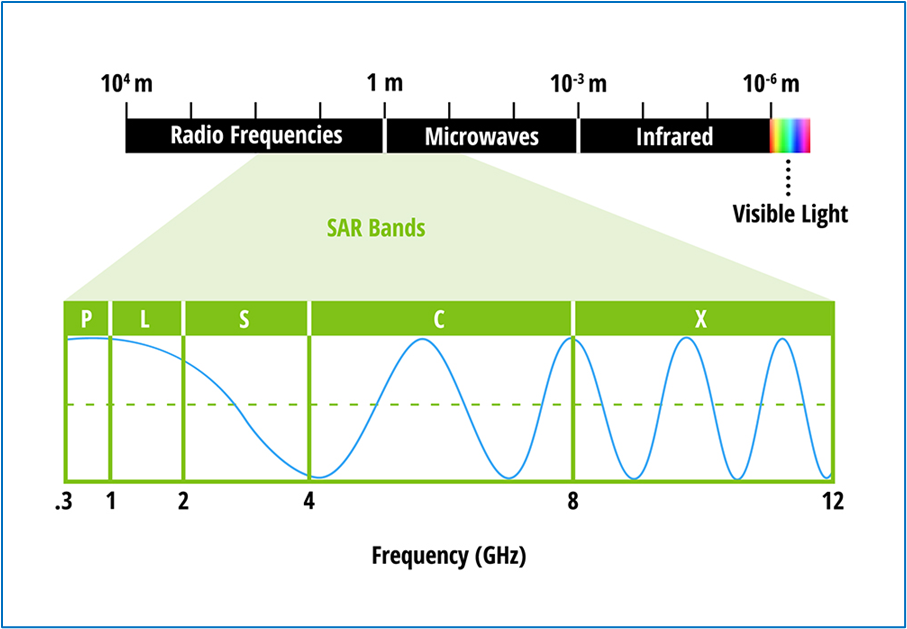
Microwaves used by SAR satellites are electromagnetic waves with wavelengths longer than infrared rays, as shown in the image below. The bands are designated P, L, S, C, X, Ku, K, and Ka bands from the short wavelength side, with the L, C, and X bands being the most commonly used.
SAR satellites detect how much and how the microwaves emitted from the sensor bounce back on the earth’s surface to observe what kind of materials are present on the surface.
For example, Tokyo Bay in January 2020 as observed by the Sentinel-1 SAR satellite can be displayed as follows. The white dots in Tokyo Bay are vessels, and you can see how many vessels are in each location.
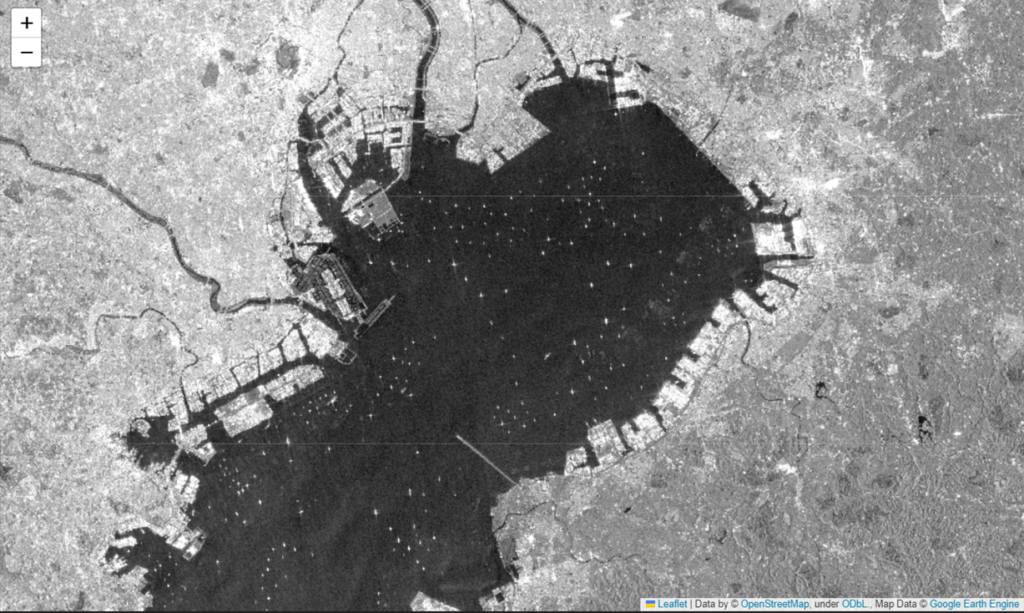
The white areas in the graph show the most reflected microwaves emitted from the Sentinel-1 sensor, indicating that the object has a structure or material that easily reflects microwaves in the direction of the sensor.
Now let’s display the Sentinel-1 image data to actually check the vessels in Tokyo Bay.
Display Sentinel-1 image data on a map
Now, let’s try to display the SAR satellite image data introduced above using python. An example implementation is shown below.
Save the following code assar_test.pyin theDesktop/labcode/python/sardirectory.
import ee
import folium

# Initialize GEE
ee.Initialize()

# Function to display GEE on folium map
def add_ee_layer(self, ee_image_object, vis_params, name):
    map_id_dict = ee.Image(ee_image_object).getMapId(vis_params)
    folium.raster_layers.TileLayer(
        tiles=map_id_dict['tile_fetcher'].url_format,
        attr='Map Data © <a href="https://earthengine.google.com/">Google Earth Engine</a>',
        name=name,
        overlay=True,
        control=True
    ).add_to(self)

# Define and filter Sentinel-1 ImageCollection.
sentinel1 = ee.ImageCollection('COPERNICUS/S1_GRD') \
    .filterDate('2020-01-04', '2020-01-05') \
    .filter(ee.Filter.listContains('transmitterReceiverPolarisation', 'VV')) \
    .filter(ee.Filter.listContains('transmitterReceiverPolarisation', 'VH')) \
    .filter(ee.Filter.eq('instrumentMode', 'IW'))

# Create a mosaic from the ImageCollection.
mosaic = sentinel1.mosaic()

# Create a map object centered on Tokyo Bay.
map = folium.Map(location=[35.5, 140.0], zoom_start=10)

# Add the mosaic as an ImageOverlay layer to the map object.
folium.Map.add_ee_layer = add_ee_layer
map.add_ee_layer(mosaic.select(['VH']), {'min': -25,'max': 5}, 'Sentinel-1 VH')
map.add_ee_layer(mosaic.select(['VV']), {'min': -25,'max': 5}, 'Sentinel-1 VV')

# Overlay multiple objects
map.add_child(folium.LayerControl(collapsed = False).add_to(map))

# Save the map
map.save('sar_test.html')
Run the Program
Open the terminal, type
$ cd Desktop/labcode/python/sarto move the directory. Now all you need to do is execute the following command. (Ignore the $ symbol.)
$ python sar_test.pyExecution Result
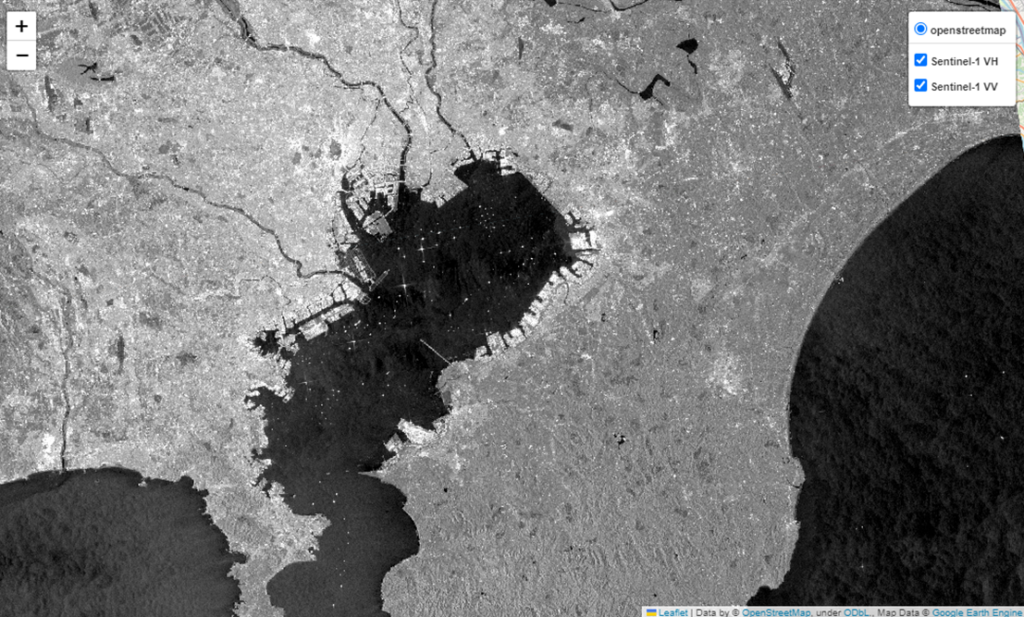
If the file sar_test.html is created in ~/Desktop/LabCode/python/sar, and when you open it, it looks like the following, you have succeeded!
Explanation of the Code
I will explain the source code written above.
import ee
import folium

# Initialize GEE
ee.Initialize()
Use GEE and folium libraries. If the library does not exist, use pip install to install it.
# Function to display GEE on folium map
def add_ee_layer(self, ee_image_object, vis_params, name):
    map_id_dict = ee.Image(ee_image_object).getMapId(vis_params)
    folium.raster_layers.TileLayer(
        tiles=map_id_dict['tile_fetcher'].url_format,
        attr='Map Data © <a href="https://earthengine.google.com/">Google Earth Engine</a>',
        name=name,
        overlay=True,
        control=True
    ).add_to(self)
Define a function to display GEE image data using folium library.
# Define and filter Sentinel-1 ImageCollection.
sentinel1 = ee.ImageCollection('COPERNICUS/S1_GRD') \
    .filterDate('2020-01-04', '2020-01-05') \
    .filter(ee.Filter.listContains('transmitterReceiverPolarisation', 'VV')) \
    .filter(ee.Filter.listContains('transmitterReceiverPolarisation', 'VH')) \
    .filter(ee.Filter.eq('instrumentMode', 'IW'))
Define the Sentinel-1 image data COPERNICUS/S1_GRD as a variable.
The fourth line filters VV and VH polarization using the transmitterReceiverPolarisationlist.
Electromagnetic wave oscillations have Vertical and Horizontal directions, and in microwaves, these directions are called polarization. SAR satellite sensors combine these two types of polarization and microwave transmission and reception to identify objects. Since VH is often used for ship observations, we will filter the data containing VH information.
In the 6 line, instrumentModefilters the data whose observation mode is IW. The Sentinel-1 is stocked with image data with an observation width of 250 km and resolution of 5 x 20 m.
# Create a mosaic from the ImageCollection.
mosaic = sentinel1.mosaic()

# Create a map object centered on Tokyo Bay.
map = folium.Map(location=[35.5, 140.0], zoom_start=10)

# Add the mosaic as an ImageOverlay layer to the map object.
folium.Map.add_ee_layer = add_ee_layer
map.add_ee_layer(mosaic.select(['VH']), {'min': -25,'max': 5}, 'Sentinel-1 VH')
map.add_ee_layer(mosaic.select(['VV']), {'min': -25,'max': 5}, 'Sentinel-1 VV')

# Overlay multiple objects
map.add_child(folium.LayerControl(collapsed = False).add_to(map))

# Save the map
map.save('sar_test.html')
In line 2, multiple image data are converted into a single image for drawing on the map. line 5 sets the display location of the map to Tokyo Bay. lines 8 to 10 add the collected Sentinel-1 image data as map objects. line 13 overlays multiple objects on the Line 13 overlays multiple objects on the map. The map creation is now complete.
Finally, save the map created in line 16 as sar_test.html.
Summary
The SAR satellites introduced here can handle information at night and in bad weather, which optical satellites are not suited for. Furthermore, by using SAR satellites together with optical satellites, we can analyze information on the earth’s surface with higher resolution.
I hope you will give it a try.