Have you ever wanted to manipulate image data (such as .jpg or .png) without using specialized software? Or perhaps you’ve thought about quantitatively evaluating the color information in an image using numerical values? Well, it turns out that image data can be treated as lists (or arrays) containing numerical values, making it easy to process and quantitatively evaluate them.
By using Python to handle image data numerically, you can also work with video, which is essentially a collection of images, greatly expanding the possibilities for data analysis.
In this blog post, we will provide a detailed explanation of how to numerically process and manipulate images (color) by converting them into lists.
Understanding Image Data
Before we delve into numerical processing of image data, it’s important to have an understanding of what image data is. Let’s briefly go over the basics of image data!
Types of Image Data
There are two types of image data that can be processed by computers: raster data and vector data.
Raster data encompasses file formats such as .jpg, .png, .tiff, .gif, and .ico.
Vector data encompasses file formats such as .pdf, .svg, and .eps.
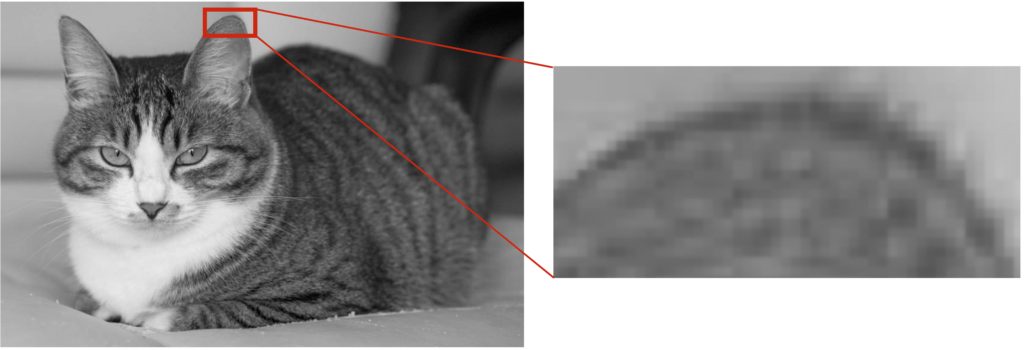
The key difference between these types of image data becomes evident when you zoom in on the image. Raster images tend to become blurry when zoomed in, while vector images remain crisp and clear. This is because raster images are composed of many small square pixels, each containing a single color (refer to the diagram above).
It’s important to note that raster images can be converted into numerical data.
Colors in Raster Images
In the previous section, we mentioned that “raster images are composed of small square pixels, each containing a single color.” For grayscale images, the shades of black and white are represented using numerical values ranging from 0 to 255 in 256 increments. A value closer to 0 represents black, while a value closer to 255 represents white. In other words, there is a one-to-one correspondence between colors and numerical values.
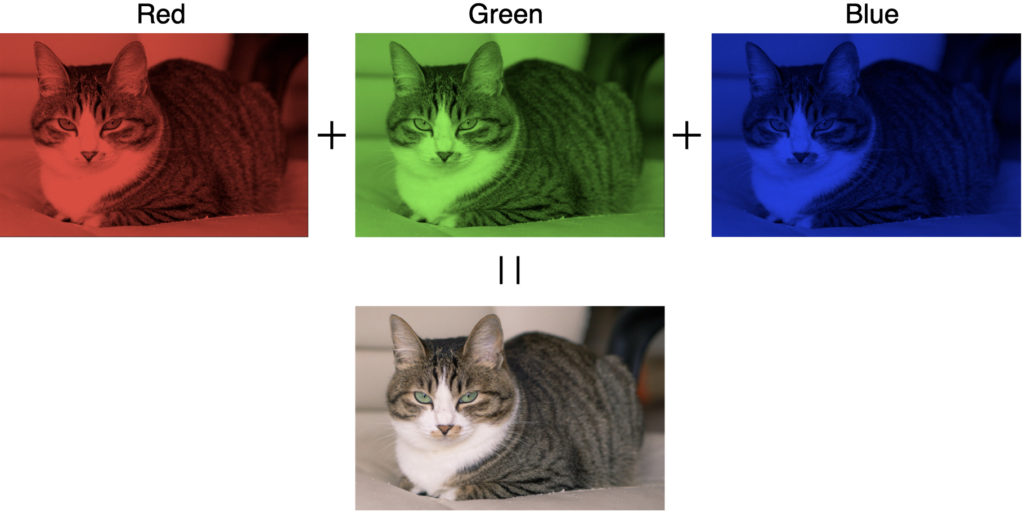
For color images (RGB), complex colors are represented by combining three layers: red (R), green (G), and blue (B) (refer to the diagram above). Each of these layers is also represented by numerical values ranging from 0 to 255, similar to grayscale images. For example, the color navy blue is represented as (R, G, B) = (34, 51, 119). Additionally, there are a total of 16,777,216 possible color combinations (256 × 256 × 256).
Converting Colors to Numerical Values
Now that we’ve covered the basics of image data, let’s summarize:
- Raster images are collections of pixels with assigned colors.
- The color of each pixel can be represented as numerical values (0-255 for grayscale, and (0-255, 0-255, 0-255) for color).
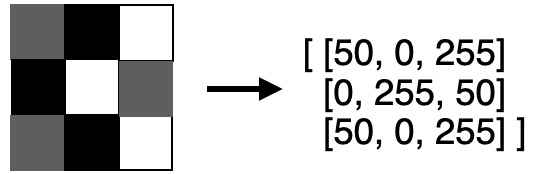
Hence, it wouldn’t be an exaggeration to say that image data can be seen as an array (or matrix) containing numerical values (refer to the diagram above).
Once you have converted image data into numerical arrays, you can perform various operations such as sorting the values, extracting specific portions, summing the values, or modifying them. In research and development, extraction and summation are commonly used techniques. Specific examples will be covered in a separate article.
Converting Images into Numerical Arrays
Converting images to and from numerical arrays can be easily done using the Pillow (PIL) module in Python. Additionally, the NumPy module is convenient for processing arrays after conversion. Let’s explore the process in detail.
Preparing Pillow (PIL) and NumPy
You can easily install Pillow (PIL) and NumPy by using the pip command. Simply enter the following commands in your terminal and press the return key:
pip install pillow
pip install numpy
If you see the word “Successfully” at the end, the installation is completed successfully. If you already have them installed, you will see “already satisfied” instead.
Preparing Image Data
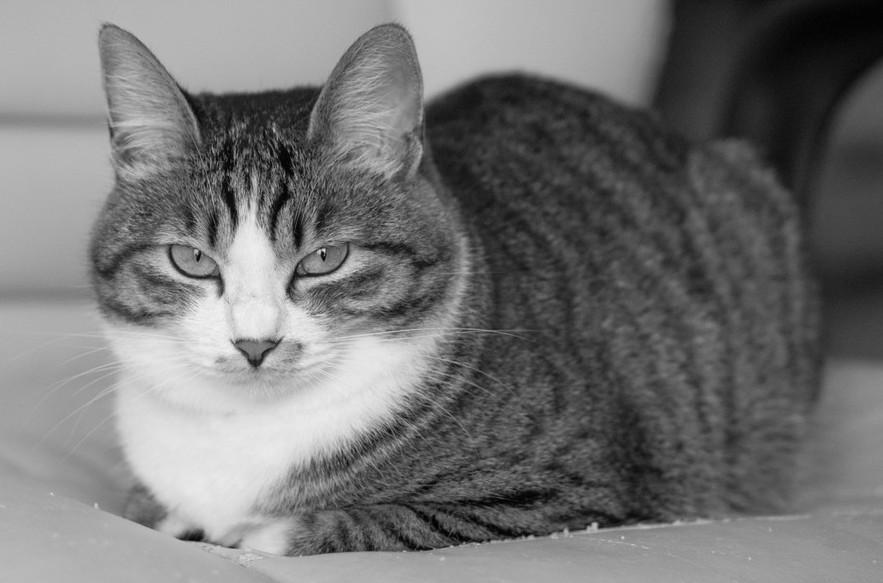
I have prepared a grayscale image of a cat (cat_gray.jpg) as the image data. Please right-click to download it. (I found it as a royalty-free image.)
Implementing the Program (Sample Code)
Without further ado, here’s the code to convert the grayscale image of a cat into a numeric array. Save it as input_image.py in Desktop/LabCode/python/data-analysis/input-image.
from PIL import Image
import numpy as np

# Load the image data
img = Image.open('cat_gray.jpg')
# Get the size of the image (width [px] x height [px]) and assign them to variables
width, height = img.size
print(img.size)
print()
# Retrieve the color of a pixel at the position 99 pixels to the right and 99 pixels down from the origin (0,0) as a numeric value
print(img.getpixel((99, 99)))
print()

# Prepare an array filled with 0s of the same size as the image
image_array = np.empty((height, width), dtype=int)
print(image_array)
print()

for y in range(height):
    for x in range(width):
        # Assign the numeric value of the pixel color sequentially
        image_array[y][x] = img.getpixel((x, y))
# You can see that the image data has been converted into a numeric array
print(image_array)
Although it may seem a bit lengthy, most of it consists of print statements and comments. The actual code that is necessary is only 8 lines long.
Once you have written the code, change the current working directory (cwd) to Desktop/LabCode/python/data-analysis/input-image in the terminal, and execute the program by entering $ python input_image.py as the command.
Output Results
(883, 583)

169

[[0 0 0 ... 0 0 0]
 [0 0 0 ... 0 0 0]
 [0 0 0 ... 0 0 0]
 ...
 [0 0 0 ... 0 0 0]
 [0 0 0 ... 0 0 0]
 [0 0 0 ... 0 0 0]]

[[176 176 176 ...   5   5   5]
 [176 176 176 ...   5   5   5]
 [176 176 176 ...   5   5   5]
 ...
 [183 183 183 ... 151 151 151]
 [183 183 183 ... 148 148 148]
 [183 183 184 ... 145 145 145]]
If the program is executed correctly, you should see the arrays and other information displayed in the terminal as shown above.
You can see that the image size is 883 pixels × 583 pixels, and the color of the pixel at coordinate (99, 99) is a gray shade with a numeric value of 169.
An array filled with 0s, the same size as the image, is prepared, and the color values are sequentially assigned using a nested for loop. In the end, image_array represents the numeric array of the image data.
Explanation of the Code
The important parts are the code to load the image data and the code to retrieve the color of a pixel as a numeric value.
img = Image.open('cat_gray.jpg')Here, we use the open method from the Image module. We pass the cat image (cat_gray.jpg) to the open method, and the information is stored in the img variable.
img.getpixel((99, 99))With the information stored in img, we use the getpixel method to retrieve the color of a specific pixel as a numeric value. In this case, the specific pixel is located at coordinates (99, 99). Since the image size is 883×583, you can retrieve the color of any position within the range (0~883, 0~583).